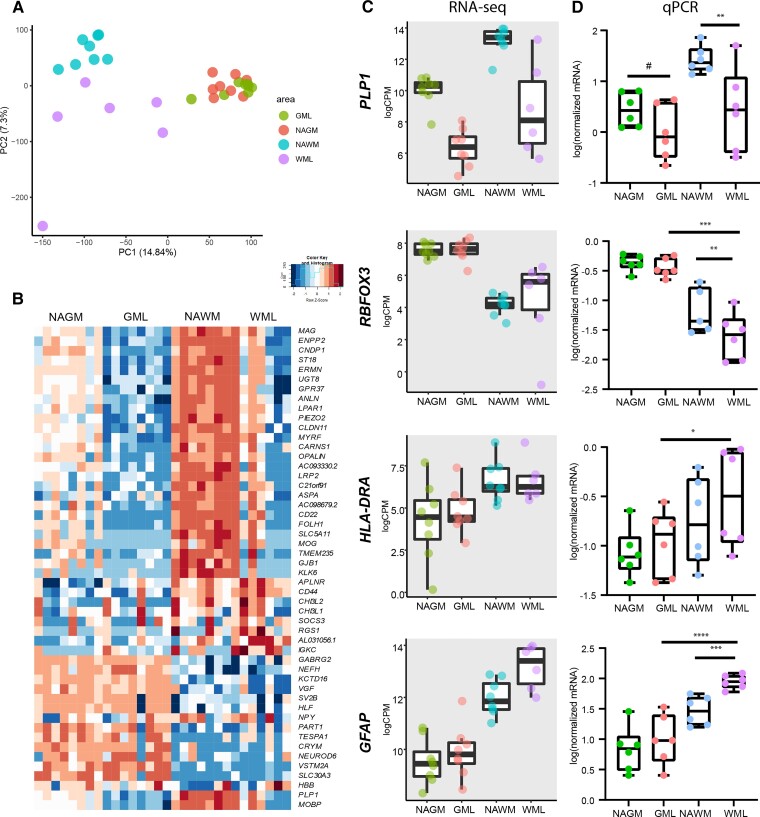
Figure 2.
Overall differences in gene expression between normal appearing and demyelinated white and grey matter. PCA plot of all samples included in RNA sequencing showing separation of WM- and GM-derived samples as well as WML- and NAWM-derived samples whereas separation of GML from NAGM samples is less clear (A). Heatmap (log CPMs) of the top 50 genes differentiating between WML, GML, NAWM and NAGM samples according to the LRT test (B). Graphs of RNA-seq results indicating common genes encoding for proteins used to stage multiple sclerosis lesions (PLP1, HLA-DRA, GFAP) and RBFOX3 representative of the presence of neurons in GM areas and less in WM areas (C). qPCR validation of RNA-seq results. N = 8 for NAGM, NAWM and GML samples, N = 6 for WML samples. *P < 0.05, **P < 0.01, ***P < 0.001, ****P < 0.0001 as shown by linear mixed models. WML, white matter lesion; GML, grey matter lesion; NAWM, normal-appearing white matter; NAGM, normal-appearing grey matter.

