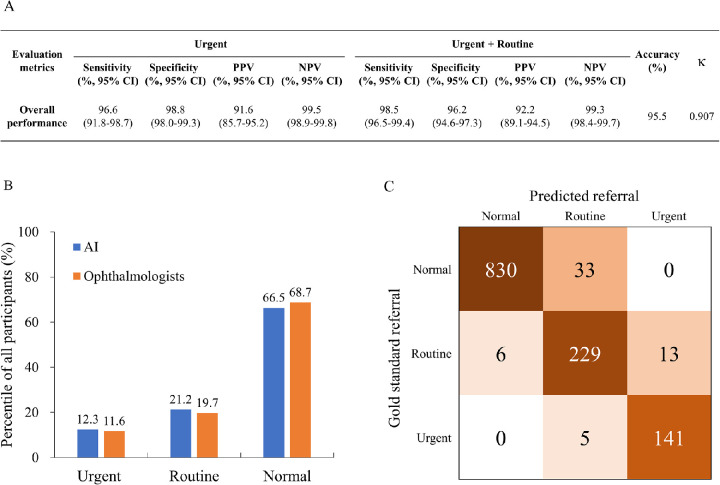
Figure 2.
Results of AI analysis for referral decisions. (A) Statistical metrics of AI referral of retinal diseases in all participants. (B) Proportion of participants with different referral levels divided by AI and ophthalmologists. (C) Confusion matrix with participant numbers that represent the combination of gold-standard referrals and predicted referrals. The number of correct referral decisions is found on the diagonal.

