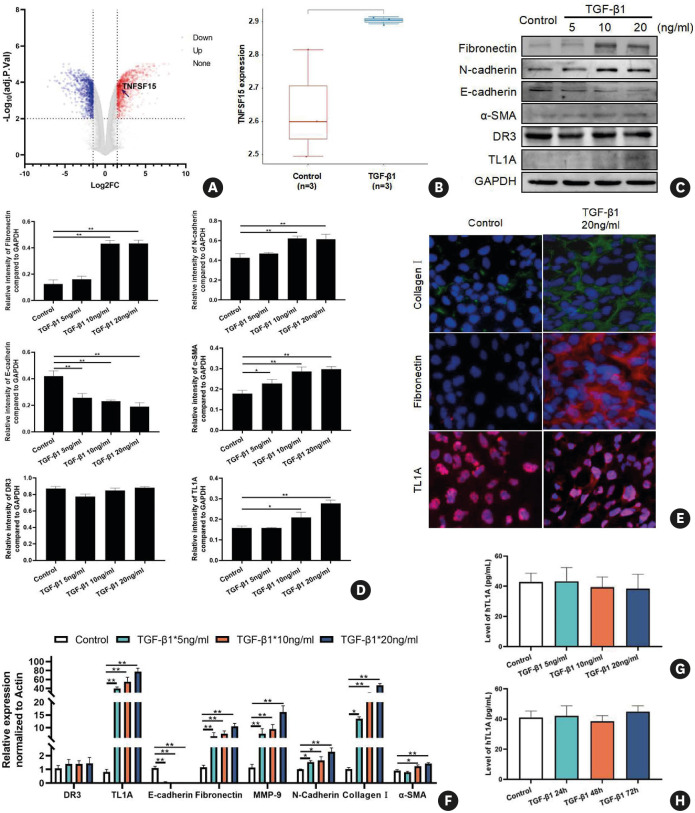
Fig. 2. TL1A levels are increased after TGF-β1 treatment in bronchial epithelial cells.
(A) Volcano plots were constructed using fold-change values and adjusted P. The red point in the plot represents overexpressed mRNAs and the blue point indicates down-regulated mRNAs with statistical significance. (B) The expression distribution of TNFSF15, where different colors represent different groups and the vertical axis represents the gene expression distribution. (C and D) Protein expression levels of E-cadherin, N-cadherin, fibronectin, DR3, TL1A, and α-SMA after treatment with different concentrations of TGF-β1 for 48 hours. (E) Immunofluorescence for collagen I, fibronectin, and TL1A after treatment with 20 ng/mL TGF-β1 for 48 hours. (F) The RNA levels of E-cadherin, collagen I, N-cadherin, fibronectin, DR3, TL1A, MMP-9. and α-SMA after treatment with different concentrations of TGF-β1 for 48 hours. (G-H) The levels of secreted TL1A remained unchanged in BEAS-2B cells treated with TGF-β1 at various concentrations and during various time courses. Data are expressed as means ± standard deviation.
TGF, transforming growth factor; TL1A, tumor necrosis factor ligand-related molecule 1A; DR3, death receptor 3; MMP-9, matrix metallopeptidase 9; α-SMA, α-smooth muscle actin; GAPDH, glyceraldehyde 3-phosphate dehydrogenase.
*P < 0.05, **P < 0.01 versus the control group.

