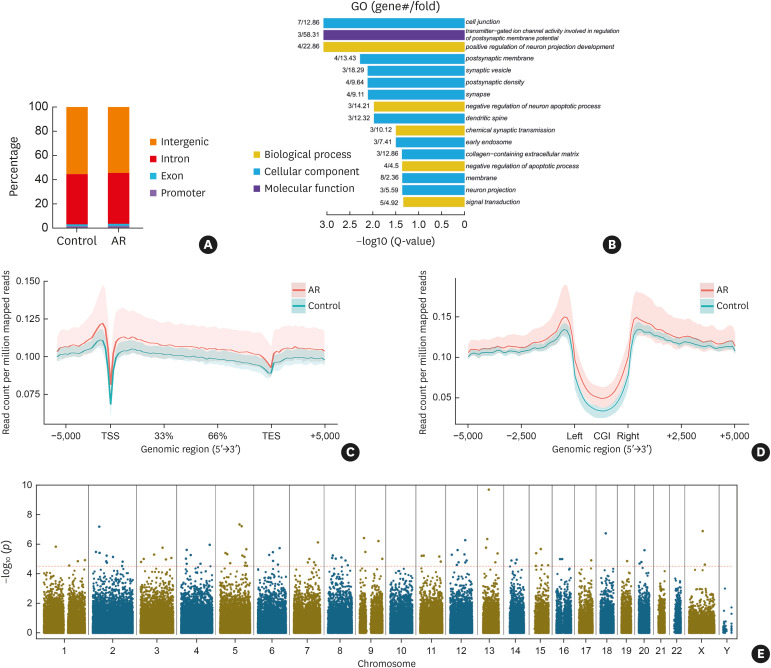
Fig. 2. Epigenome-wide 5hmC distribution and DhMR in CD4+ T cells of AR patients. (A) The percentage of 5hmC-occupied peaks in promoter, exon, intron, and intergenic regions. (B) DhMG were analyzed by GO and enriched in biological process, cellular component, and molecular function. The P value indicates the significance of DhMG enriched in GO terms. (C) The normalized read count for 5hmC across the gene body ± 5 kb flanking regions with 100 bp resolution is shown. (D) The normalized read count for 5hmC around ± 5 kb regions flanking CGI centers with 100 bp resolution is shown. The solid red and blue lines indicate the average count for the AR and control group, respectively, while the red and blue shadows indicate the range of counts for the AR and control groups, respectively. (E) The Manhattan plot shows the chromosome distribution and significance of the differences in all the 143,812 5hmC-occupied peaks between AR patients and healthy volunteers. The red dotted horizontal line represents the FDR corrected threshold (FDR < 0.05) of genome-wide significance.
Control, healthy volunteers; AR, allergic rhinitis; 5hmC, 5-hydroxymethylcytosine; DhMR, differentially hydroxymethylated regions; DhMG, differentially hydroxymethylated genes; GO, Gene Ontology; CGI, CpG island; FDR, false discovery rate.

