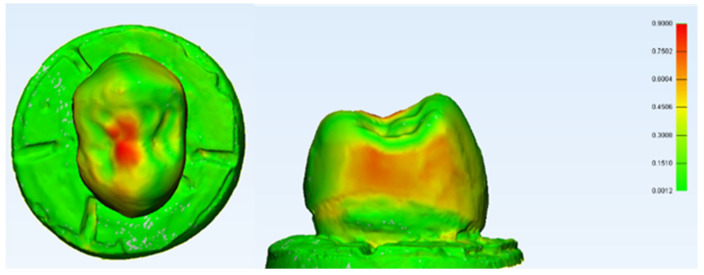
Figure 22.
3D submerged pre-and post-test scanning for a PEEK crown after the static compressive test. The technique was colour map-based, as depicted in the above figure. The red represented the most deformed area, the yellow was the lesser deformed area while the green was the area that remained physically unchanged compared to the shape prior to the loading. From the histogram data, the area of deformation happened in the range of 0.0012 mm to 0.90 mm with a mean of 0.1559 mm and a standard deviation (SD) of 0.1586.

