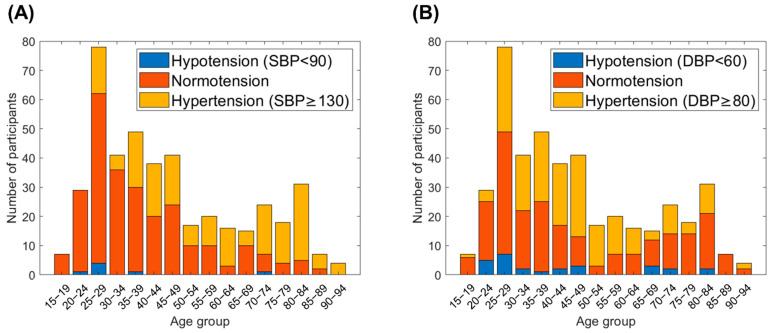
Figure 7.
The distribution of actual SBP and DBP levels over different age groups in our clinical database. (A) Distribution of SBP levels. (B) Distribution of DBP levels. Blue column represents the number of participants in hypotension. Orange column represents the number of participants in normotension. Yellow column represents the number of participants in hypertension. The age of participants covered from 15 to 94 years old. The hypertension and the hypotension populations were also included which was suitable for the true population.

