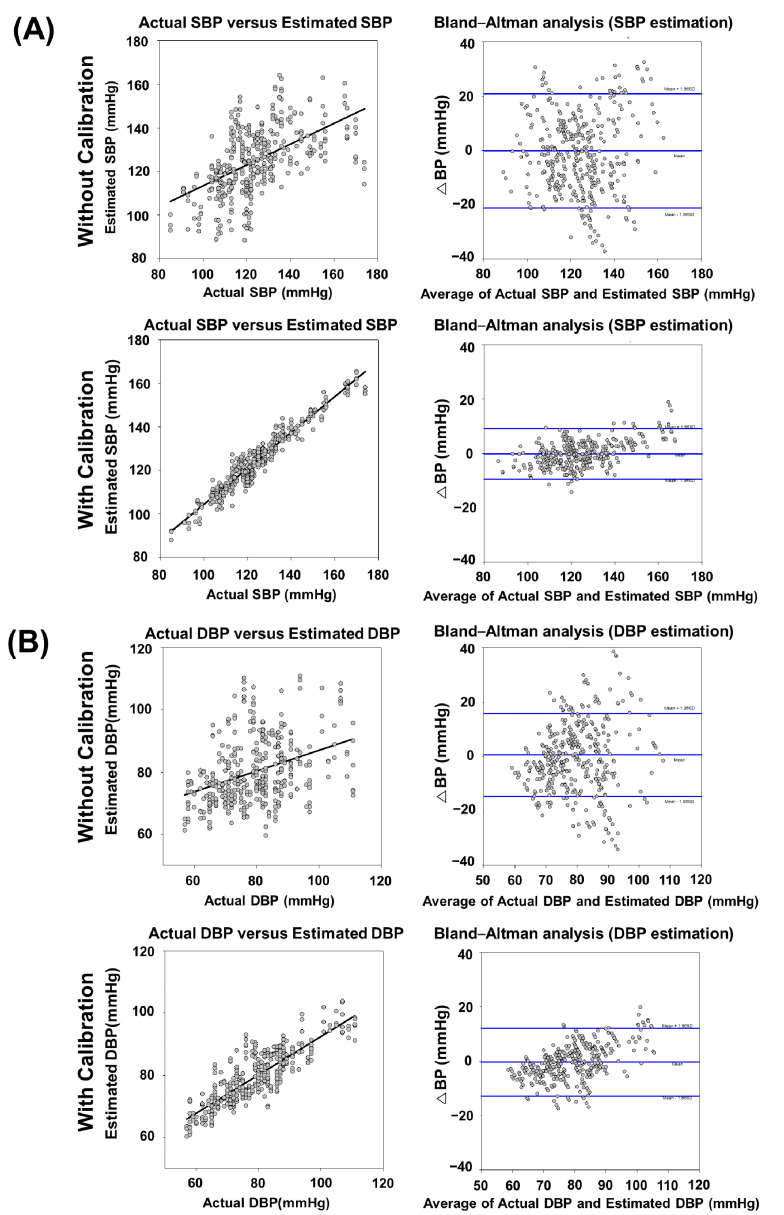
Figure 10.
Relationship between actual BP measurement and exponential-GPR estimated BP in the analysis of correlation coefficient and Bland-Altman plot for ΔBP between actual BP measurement and exponential-GPR BP estimation. (A) SBP measurement without calibration showed a moderate correlation (r-value = 0.538 and its associated p = 1.84 × 10⁻³⁰) with a mean ΔBP of −0.1809 mmHg (CI = −21.1876 to 20.8258) between actual BP measurement and exponential-GPR BP estimation. SBP measurement with calibration showed an excellent correlation (r-value = 0.968 and its associated p = 1.20 × 10−232) with a mean ΔBP of −0.1776 mmHg (CI = −9.4603 to 9.1051) between actual BP measurement and exponential-GPR BP estimation. (B) DBP measurement without calibration showed a fair degree of relationship (r-value = 0.373 and its associated p = 3.10 × 10⁻¹⁵) with a mean ΔBP of 0.5539 mmHg (CI = −14.7611 to 15.8689) between actual BP measurement and exponential-GPR BP estimation. DBP measurement with calibration showed an excellent correlation (r-value = 0.854 and its associated p = 3.81 × 10−111) with a mean ΔBP of −0.3846 mmHg (CI = −12.8674 to 12.0982) between actual BP measurement and exponential-GPR BP estimation. The mean ΔBP of the data was illustrated by the central horizontal line (blue) of Bland–Altman analysis. Upper and lower reference lines (blue) showed the upper and lower limits of agreement (95% confidence intervals (CIs)).

