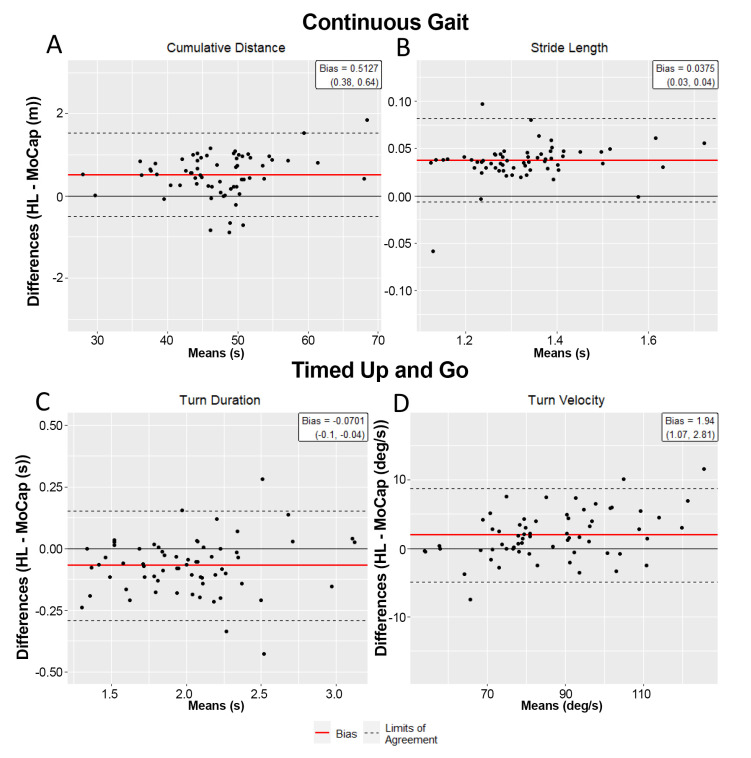
Figure 3.
Bland–Altman plots for continuous walking (A,B) and TUG (C,D) metrics. (A) Average cumulative distances over the 60 s walk for the HL2 and MoCap were 47.46 (7.26) and 46.95 (7.15) m, respectively, with the average bias (HL2-MoCap) of 0.51 m and LOA of (−0.50, 1.52) m. (B) For average stride length, the average bias was 0.04 m with LOA of (−0.01, 0.08) m. (C) For turn duration, the average bias of the HL2 was −0.07 s with LOA of (−0.29, 0.15) s. (D) For turn velocity, the average bias was 1.94 deg/sec with LOA of (−4.89, 8.77) deg/s.

