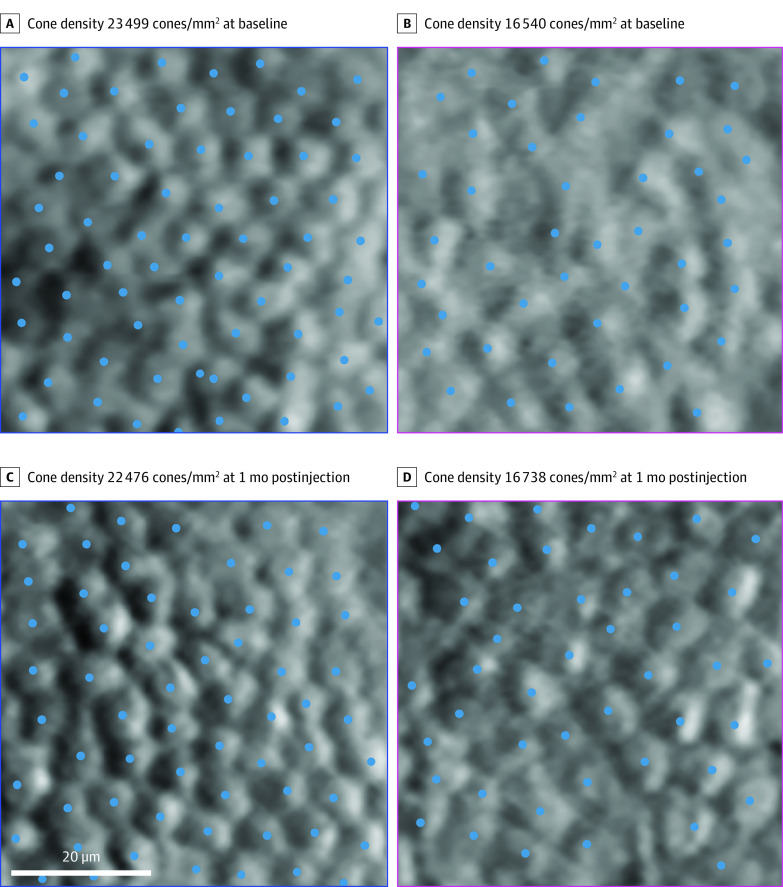
Figure 2. Adaptive Optics Regions of Interest Aligned Between Time Points From the Injected Eye of Patient 06.
An intact cone mosaic is visible before and after the subretinal injection of adeno-associated virus-mediated hCHM. Cones were manually identified (blue dots) and bound cone density was calculated for each region of interest. The adaptive optics montages in Figure 1 show the retinal locations of the 2 regions of interest, based on the corresponding blue and magenta colored squares.

