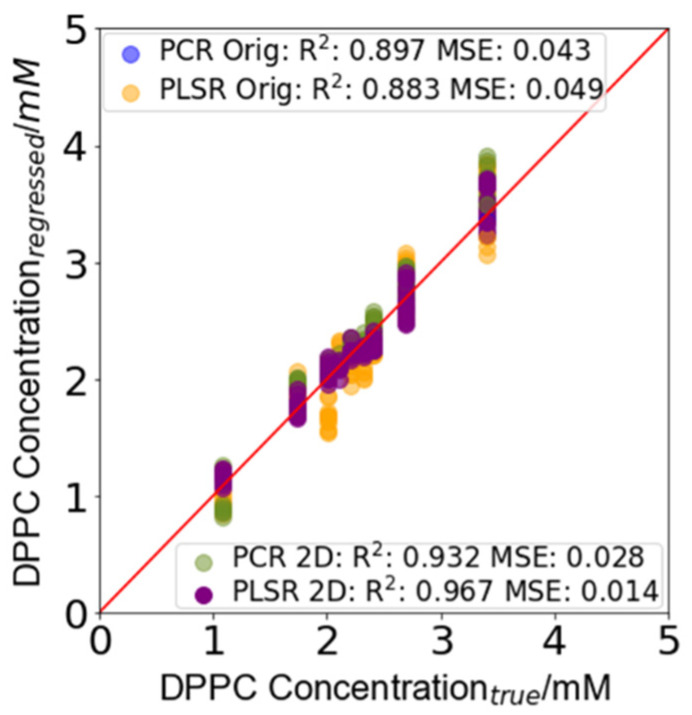
Figure 4.
DPPC concentration prediction in the test set samples. The prediction error for each of the models is summarized in Table 3 (further information can be found in Supplementary Information). The largest prediction interval for the PCR Orig model was +0.38 mM, −0.46 m, that for the PLSR Orig model was +0.67 mM, −0.78 m, that for the PCR 2D model was +0.30 mM, −0.38 m, and that for the PLSR 2D model was +0.29 mM, −0.37 mM.

