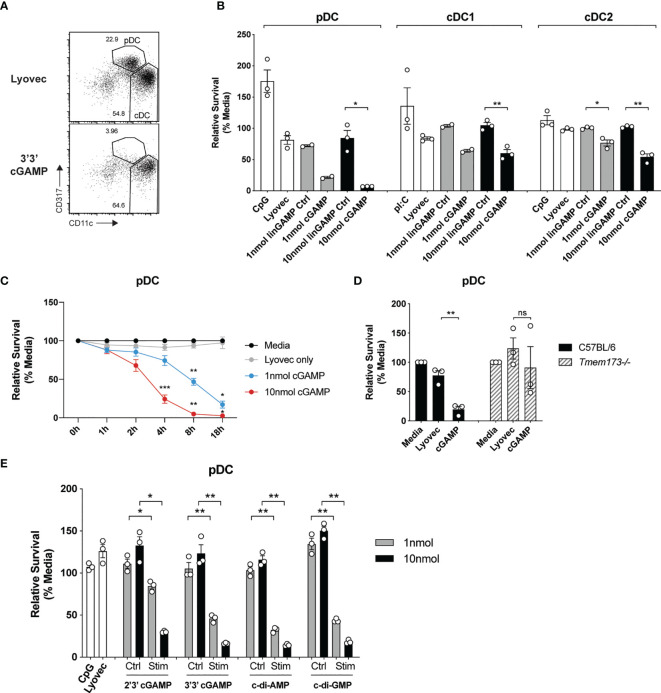
Figure 3.
cGAMP stimulation induces rapid, potent killing of mouse pDCs. (A) FACS plots showing bulk mouse splenic pDCs (CD11cintCD317hi) and cDCs (CD11chiCD317lo) stimulated for 18 h with 10 nmol 3’3’ cGAMP complexed with lyovec, or lyovec alone. (B) Sorted mouse splenic pDCs and cDC subsets from a pool of 15-17 mice were stimulated for 18 h with 1 or 10 nmol 3’3’ cGAMP, its linearized control ligand (linGAMP Ctrl) complexed with lyovec, lyovec alone, 0.5 μM CpG2216 or 100 μg/mL pI:C. Bar graphs show the mean relative survival (compared to media alone) ± SEM compiled from 2-3 independent experiments. (C) Bulk splenic DCs from a pool of 5-6 mice per replicate were stimulated with 1 or 10 nmol 3’3’ cGAMP complexed with lyovec or lyovec alone for the indicated time points. Line graph depicts the mean relative survival (compared to media alone) ± SEM combined from 3 independent experiments. (D) Bulk splenic DCs from C57BL/6 or Tmem173-/- mice were stimulated with 10 nmol 3’3’ cGAMP complexed with lyovec or lyovec alone for 18 h. Bar graphs show their mean pDC relative survival ± SEM from 3 individual mice per genotype. (E) Bulk splenic DCs were stimulated with 1 or 10nmol 2’3’ cGAMP, 3’3’ cGAMP, c-di-AMP or c-di-GMP complexed with lyovec, their respective linearized control ligands (Ctrl) complexed with lyovec, lyovec alone or 0.5 μM CpG2216 for 18 h. Bar graphs represent the mean relative survival of pDCs ± SEM from 3 biological replicates (pool of 2 mice per replicate). Statistical analyses were performed using (B, D, E) two-tailed Paired Student’s t test or (C) two-way ANOVA using Tukey’s test to correct for multiple comparisons where *P < 0.05, **P < 0.01, ***P < 0.001 and ns, not significant.

