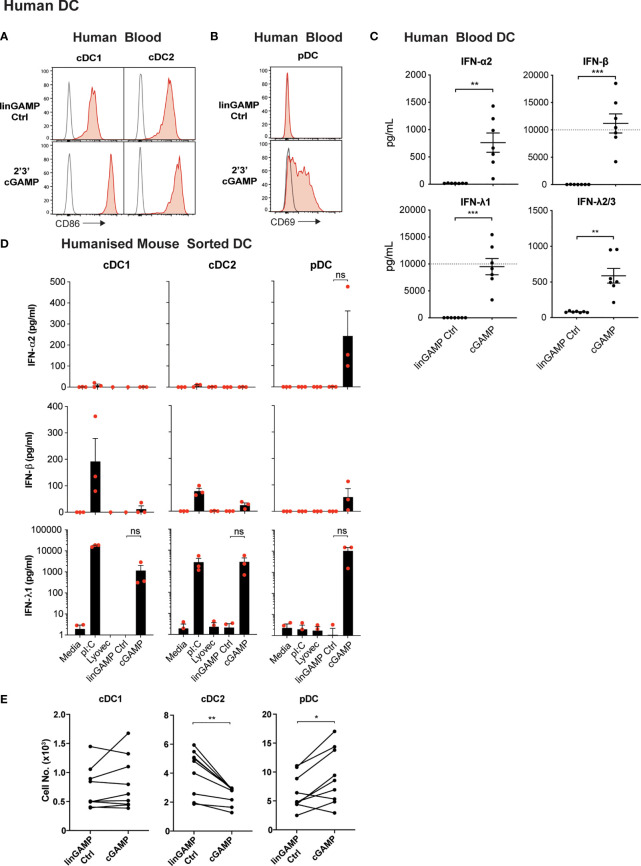
Figure 6.
Human DCs demonstrate potent activation and differential IFN production, but not pDC death, after cGAMP stimulation. (A–C) Human blood DCs were stimulated with 5 nmol 2’3’ cGAMP or its linearized control ligand (linGAMP Ctrl) complexed with lyovec for 18 hrs. Histograms show activation marker expression on human blood (A) cDCs or (B) pDCs. Grey unfilled lines represent isotype control and red filled lines represent Ab stain. (C) Dots represent IFN production by DCs from each donor and lines show mean ± SEM of 7 donors from 3 independent experiments. Dotted line represents upper limit of quantification. (D) Sorted humanised mice DCs from BM were stimulated with 10 μg/mL pI:C, 10 nmol 2’3’ cGAMP or its linearized control ligand (linGAMP Ctrl) complexed with lyovec or lyovec alone for 18h. Bar graphs depict IFN production by each humanised mice DC subset showing mean ± SEM from 3 independent experiments. Human DC IFN production was analysed by flow cytometric bead assay. (E) Human blood DCs were stimulated with 5 nmol 2’3’ cGAMP or its linearized control ligand complexed with lyovec for 18 h and DC numbers enumerated by flow cytometry. Line graphs show paired individual cell numbers for each donor for each DC subset (n=9). Statistical analyses were performed using two-tailed Paired Student’s t test where *P < 0.05, **P < 0.01, ***P < 0.001 and ns, not significant.

