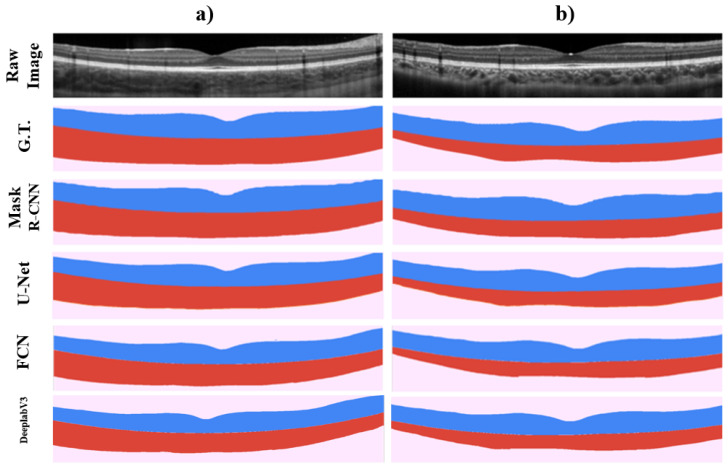
Figure 7.
Graphical example of two different OCT images (Raw Image), showing their full retina and choroid tissue ground truth (G.T.), and segmentation output probability maps when using the Mask R-CNN, U-Net, FCN and DeeplabV3 methods on each image respectively. Each row shows the proper segmentation map for the OCT image showed in columns (a,b).

