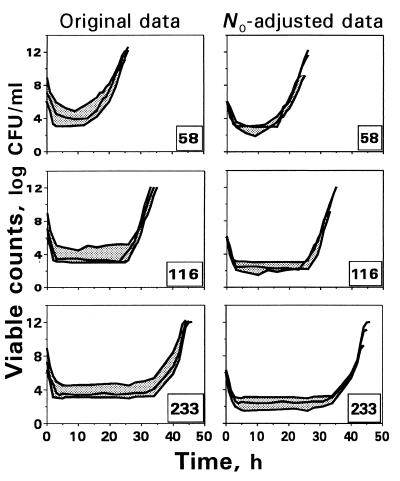
FIG. 5.
An attempt to superimpose the time-kill curves of E. coli exposed to trovafloxacin by shifting them to account for the difference in the starting inocula. The number in the right corner of each plot indicates the simulated AUC/MIC (in [micrograms × hours/milliliter]/[micrograms/milliliter]).

