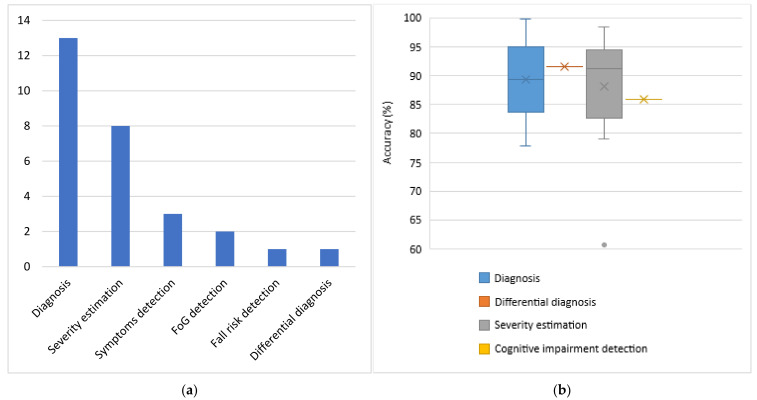
Figure 8.
PD problems addressed based on data collected via a combination of various types of sensors and the respective obtained accuracies. (a) Number of studies per task; (b) accuracies obtained from the proposed models for each category of addressed tasks. Number of studies considered in this boxplot per task: n = 9 for diagnosis, n = 1 for differential diagnosis, n = 5 for severity estimation and n = 1 for cognitive impairment detection.

