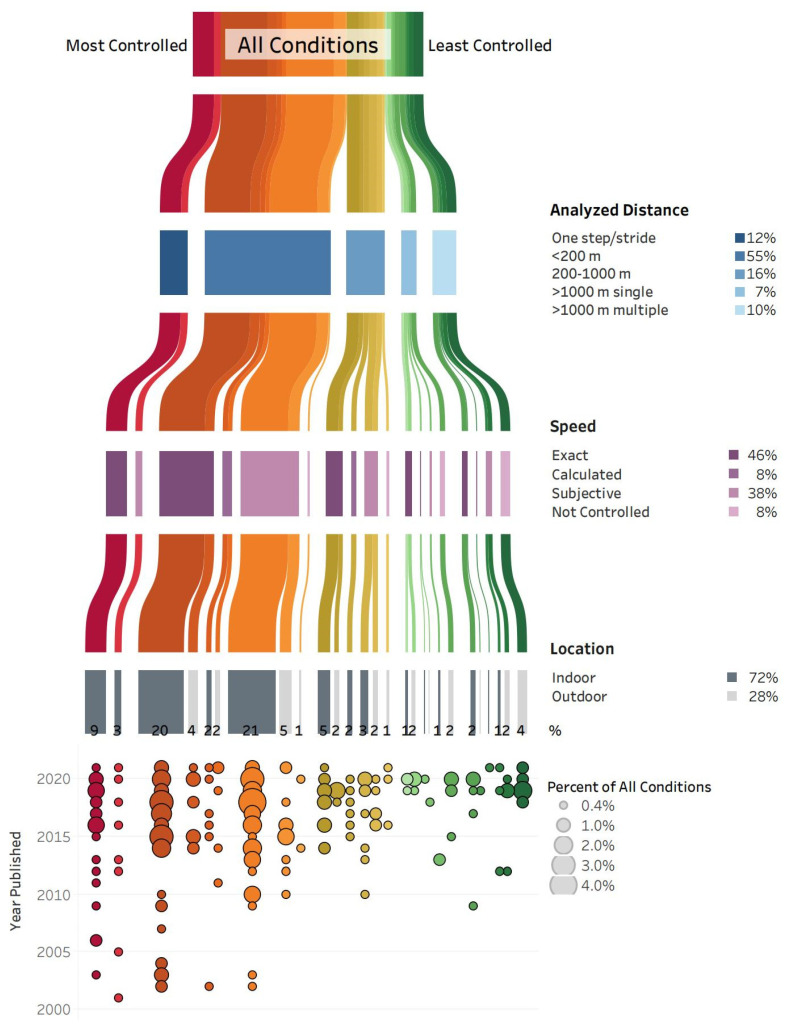
Figure 2.
All conditions (262 across 231 studies) are grouped according to the analyzed distance, speed, and location. The condition groups are ranked from most controlled (red, on the left) to least controlled (green, on the right), and the width of each line corresponds to the percent of all conditions within that group. The degree of control is based on the analyzed distance (one step/stride is more controlled than >1000 m), speed (exact is more controlled than not controlled), and location (indoor is more controlled than outdoor). The percent of all conditions for each category of analyzed distance (shades of blue), speed (shades of purple), and location (shades of grey) is reported. In the bottom panel, the percent of all conditions within each group are further separated by year the study was published, with larger circles corresponding to a greater percent of all conditions. Note: 24 conditions that could not be categorized due to lack of information are not included in this figure.

