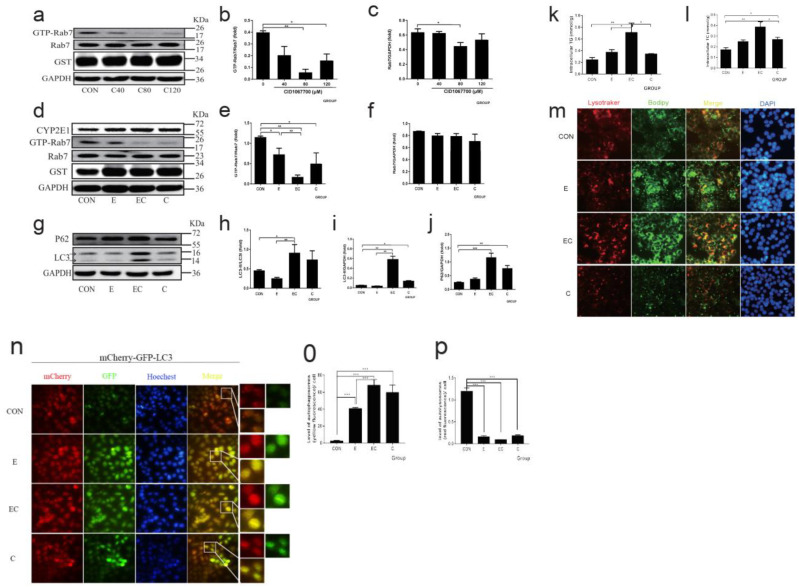
Figure 4.
Pharmacological inhibition of Rab7 aggravates alcoholic-induced decreased lipophagy in HepG2 cells. (a) Western blot of GTP-Rab7 (obtained by GST-RILP pulldown) and total Rab7 of HepG2 cells treated with 40 μM, 80 μM, and 120 μM CID1067700, respectively. (b,c) Densitometry analysis of (a). (d) Western blot of GTP-Rab7 (obtained by GST-RILP pulldown) and total Rab7. (e,f) Densitometry analysis of (d). (g) Western blot of LC3 and P62. (h–j) Densitometry analysis of (g). The GAPDH was used as a protein loading control, and the results were quantified in three independent experiments per condition. (k) TG of HepG2 cells. (l) TC of Hepg2 cells. (m) Co-localization of lysosomes (LysoTracke-red) and LDs (BODIPY493/503) observed by inverted fluorescence microscope (400×). (n–p) Live-cell imaging of HepG2 cells expressing mCherry-GFP-LC3 to explore the autophagic flux observed by the inverted fluorescence microscope (400×). Data shown are means ± SEM (n = 3). * p < 0.05, ** p < 0.01, *** p < 0.001. CON: normal control group; E: ethanol group; EC: ethanol plus CID1067700 group; C: CID1067700 group.

