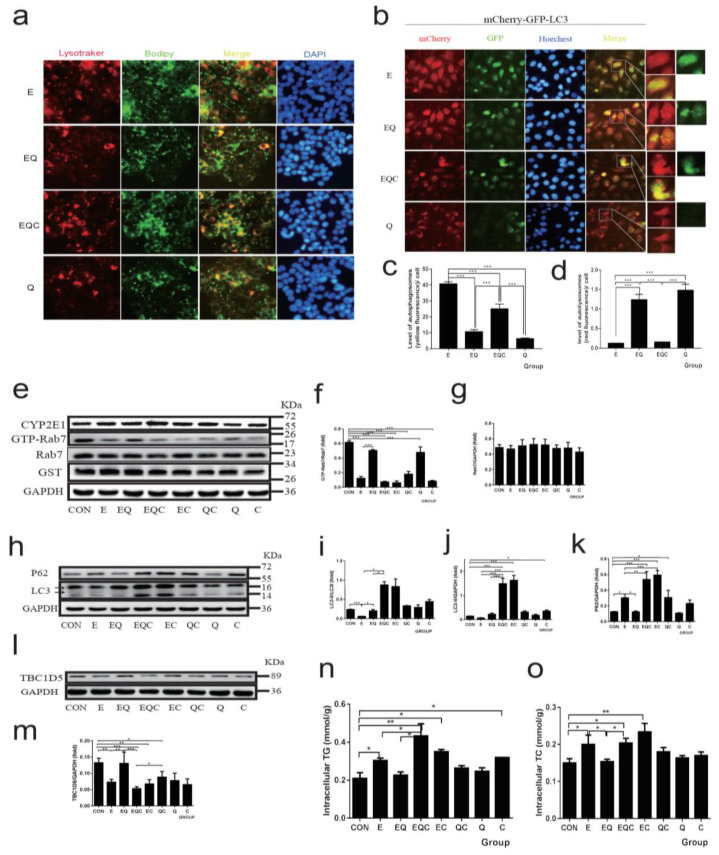
Figure 6.
Effect of quercetin on lipophagy and autophagy flux by regulating Rab7 in Hepg2 cells. (a) Co-localization of lysosomes (LysoTracke-red) and LDs (BODIPY493/503) was observed by an inverted fluorescence microscope (400×). (b–d) Live-cell imaging of Hepg2 cells expressing the mCherry-GFP-LC3 to explore the autophagic flux observed by the inverted fluorescence microscope (400×). (e) Western blot of GTP-Rab7 (obtained by GST-RILP pulldown) and total Rab7. (f,g) Densitometry analysis of (e). (h) Western blot of LC3 and P62. (i–k) Densitometry analysis of (h). (l) Western blot of TBC1D5. (m) Densitometry analysis of (l). The GAPDH was used as a protein loading control, and the results were quantified in three independent experiments per condition. (n) TG of Hepg2 cells. (o) TC of Hepg2 cells. Data shown are means ± SEM (n = 3). * p < 0.05, ** p < 0.01, *** p < 0.001. CON: normal control group; E: ethanol group; EQ: ethanol plus quercetin group; EQC: CID1067700 an ethanol plus quercetin group; EC: ethanol plus CID1067700 group; QC: quercetin plus CID1067700 group; C: CID1067700 group Q: quercetin group.

