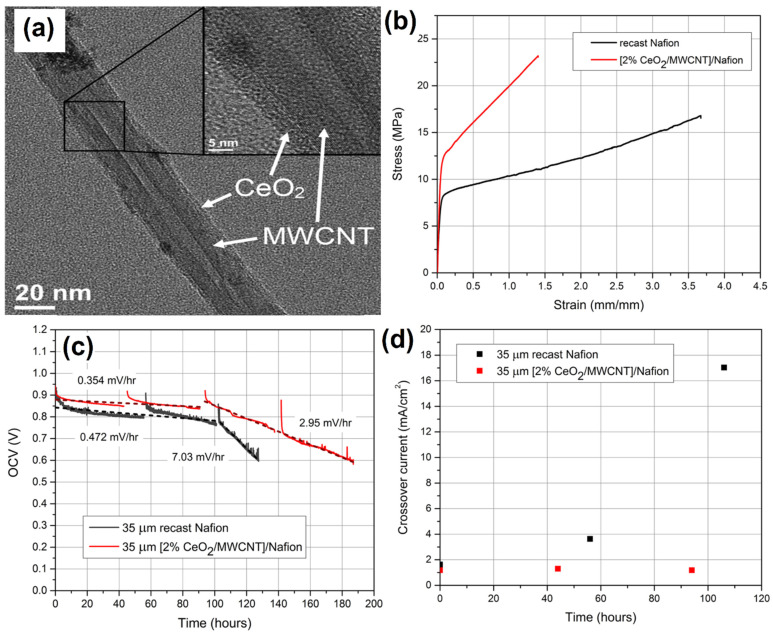
Figure 14.
(a) TEM micrographs showing MWCNT after ceria treatment. (b) Typical stress–strain curves for NAF and [2% CeO2/MWCNT]/NAF membranes at 23 °C and 50% RH. (c) OCV decay of recast NAF and [2% CeO2/MWCNT]/NAF at 90 °C and 30% RH with H2/O2 flow rates of 100/200 sccm. (d) Gas crossover of recast NAF and [2% CeO2-MWCNT]/NAF membranes during OCV hold. Reprinted with permission from [130]. The American Chemical Society, Washington, DC, USA, 2014.

