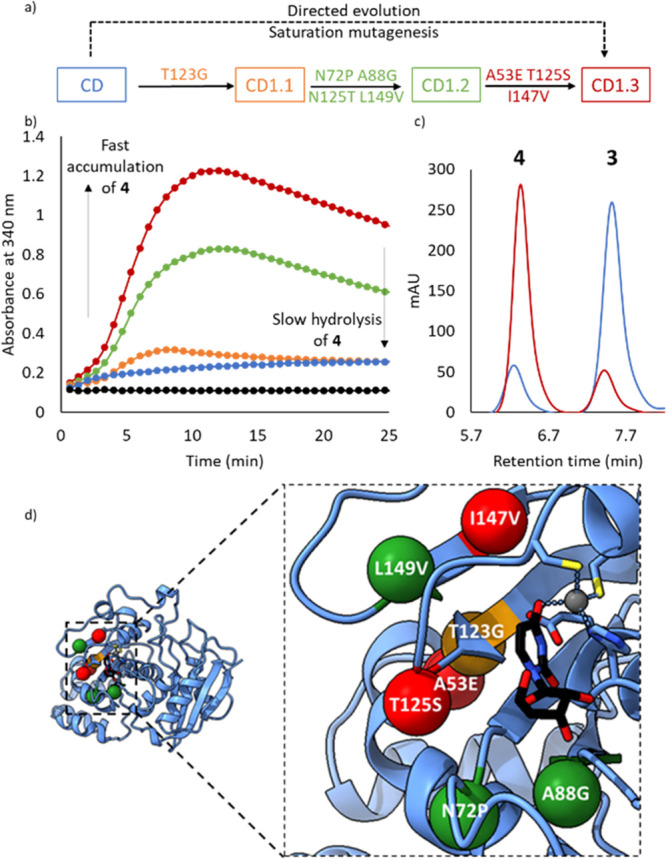
Figure 3.

Directed evolution of a cytidine deaminase (CD). (a) Directed evolution of CD to CD1.3 showing mutations installed during each round. (b) Time course for the formation of 4 from 2 (50 mM) catalyzed by CD1.3 (2.5 μM, red), CD1.2 (2.5 μM, green), CD1.1 (2.5 μM, orange), wild-type CD (2.5 μM, blue), and no enzyme (black) in the presence of 1% (∼300 mM) NH2OH, pH 7. (c) HPLC traces showing 2 (500 mM) conversion to 4 and 3 catalyzed by CD1.3 (25 μM, red) and wild-type CD (25 μM, blue) in the presence of 10% (∼3 M) NH2OH, pH 7. (d) The active site of CD with uridine bound (PDB code: 1AF2). Mutations installed in rounds 1, 2, and 3 are shown as orange, green, and red spheres, respectively. The uridine ligand is shown as atom-colored sticks with black carbons, and the Zn2+ cofactor is shown in gray. His102, Cys129, Cys132, and catalytic Glu104 are shown as atom-colored sticks with blue carbons.
