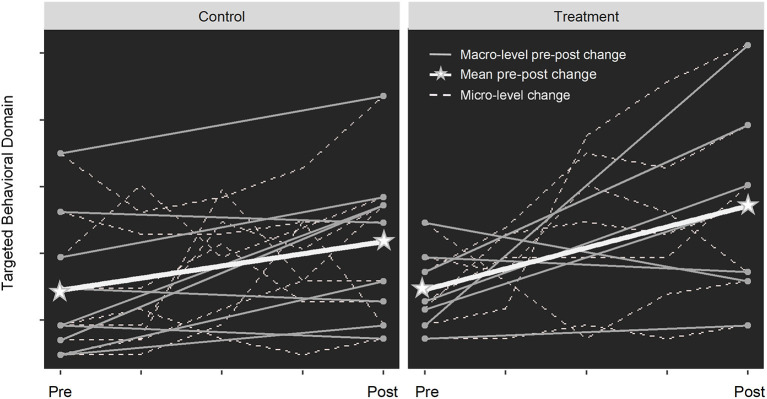
Figure 1.
The “black box” of treatment effect in RCTs. In an RCT design, participants are randomized to treatment or control groups with matched baseline characteristics. When only calculating the average change from pre- to post-treatment (thick white lines), the larger increase observed in the treatment group may lead to the conclusion that the treatment is effective (assuming significant group difference), despite the individual-level heterogeneous response (gray lines). When breaking the treatment period into smaller intervals, the micro-level change (dashed lines) reveals that the rate of change varies across individuals over time, indicating time-varying treatment effects. Regarding “opening the black box”, we are not referring to unblinding the clinical trial procedures, but rather adopting study designs (e.g., more frequent data collection with more refined outcome measures over a longer time span) and analytical approaches (e.g., trajectory analyses) that allow for examining the finer-grained changes in treatment response.

