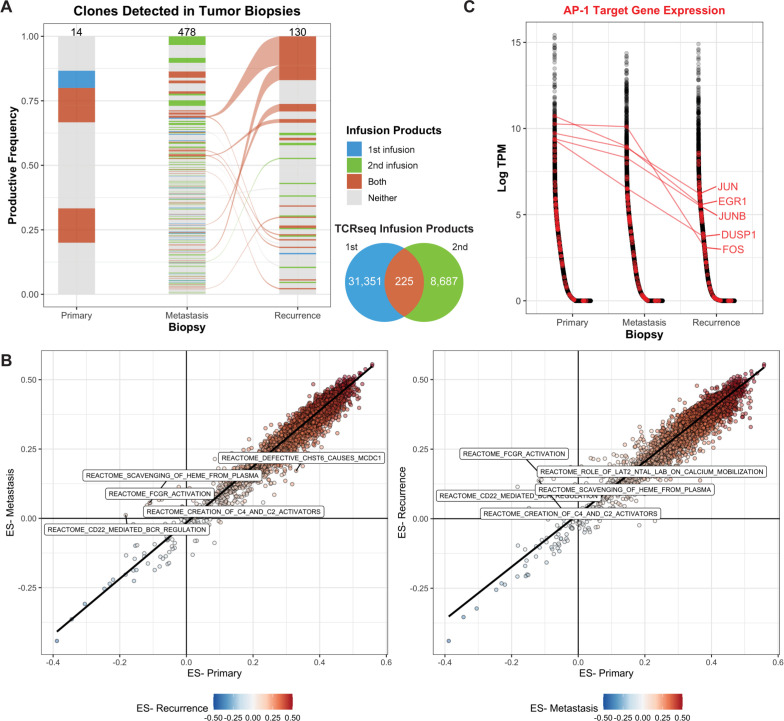
Figure 2.
Transgenic TCR products persist over the course of disease progression. (A) TCR clones that were detected in the sorted NY-ESO-1 TCR+ infusion products (either the first, second, or both) were identified in TCRseq derived from bulk tumor DNA. The number of clones detected in each product is indicated by the Venn diagram and by the numbers at the top of each bar. The width of the clone indicates the productive frequency of the TCR repertoire, excluding the NY-ESO-1 TCR, and clones connected between timepoints (alluvium) indicate that it was detected in both the metastasis and recurrent lesions. (B) Single-sample gene set enrichment analysis was used to quantify the ES across annotated gene sets. Each point represents a gene set, comparing either the metastasis (left) or recurrence (right) to the primary lesion. The top five reactome datasets with the highest differences in ES are labeled. (C) Genes (x-axis) were sorted by decreasing expression in log2-transformed transcripts per million (log-TPM, y-axis) within each biopsy transcriptome profiling. Genes associated with the Pathway Interaction Database AP1 pathway (transcription factor network) are labeled in red, and a selected subset is labeled. ES, enrichment score; TCR, T-cell receptor.

