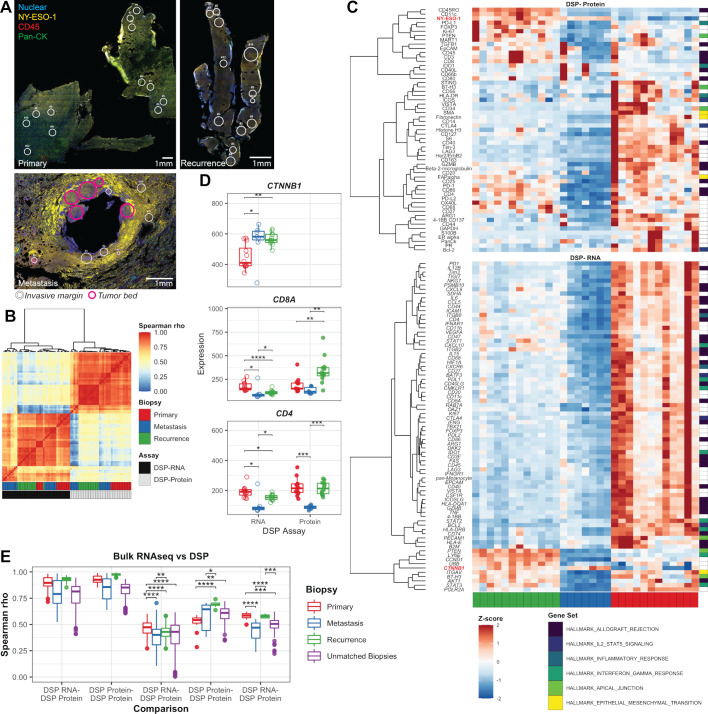
Figure 3.
Spatial profiling across samples. (A) Confocal microscopy images: overlaying nuclear staining (blue), NY-ESO-1 (yellow), pan-cytokeratin (green), and CD45 (red) were used to identify ROIs, indicated by circles. Pink circles in the metastasis lesion indicate those that were within the tumor region. (B) Heatmap of the Spearman rank correlation across all matched protein–RNA markers for all ROIs assessed. Each ROI is indicated by the corresponding biopsy and assay by the color bars at the bottom of the plot. (C) Heatmap of the marker-scaled expression of proteins (top) and genes (bottom) assessed across ROIs; non-tumor regions from the metastasis are not included in this figure. Markers were clustered by assay type and scaled expression using unsupervised hierarchical clustering with Ward agglomeration. Markers are also annotated on the right by corresponding hallmark gene sets. (D) Raw expressions of CTNNB1, CD8/CD8A, and CD4/CD4 are shown on the y-axis across ROIs derived from each sample (denoted by color). (E) The Spearman rank correlation (y-axis) was quantified across all matched protein or RNA markers across ROIs and between ROIs and matched bulk RNA samples. Comparisons are indicated along the x-axis. (D, E) Pairwise Wilcox tests were performed across groups. Non-significant comparisons are not shown; significant differences are indicated across comparisons. *P<0.05, **P<0.01, ***P<0.001, ****P<0.0001. DSP, digital spatial profiling; ROI, region of interest;

