Figure 2.
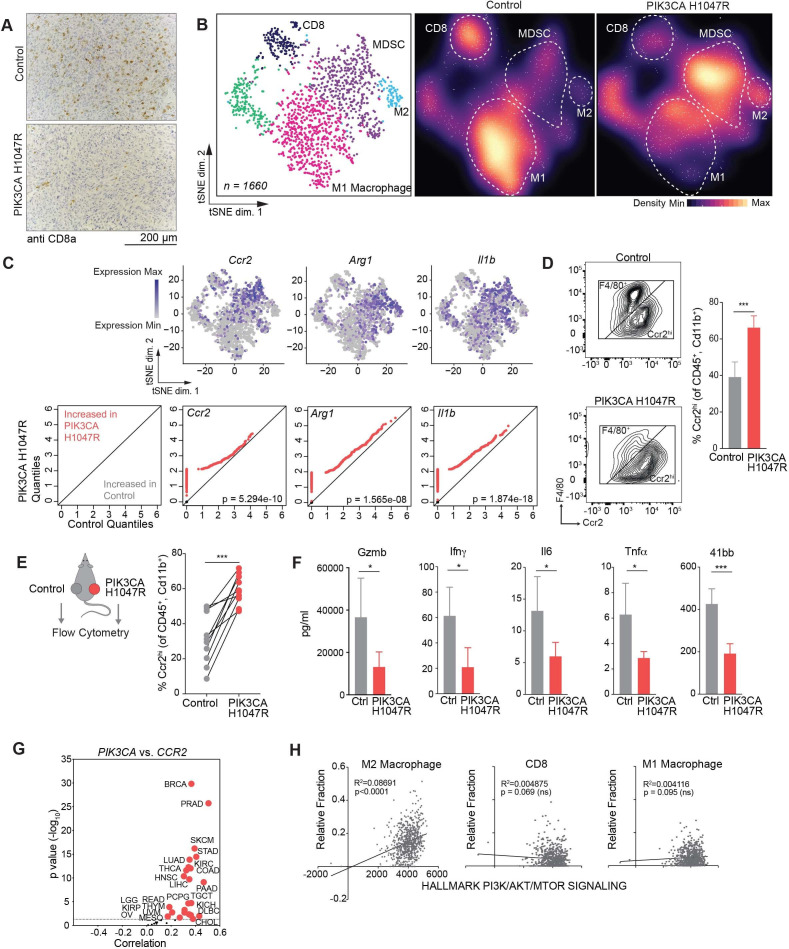
Phospho-inositol 3 kinase (PI3K) signaling promotes an immune suppressive myeloid microenvironment. (A) Immunohistochemistry showing CD8+ T cells in control or PIK3CA H1047R MC38 day 15 tumors after antiprogrammed cell death protein 1 treatment (n=5 mice per group). Quantification in online supplemental figure A. (B) tSNE projection (left) and density plots (center and right) of single-cell RNA-sequencing profiles from CD45+ tumor infiltrating immune cells from control or PIK3CA H1047R MC38 tumors at day 15, colored by cluster in tSNE. (C) Paired quantile–quantile (Q–Q) plots comparing the expression of a curated set of genes in immune cells from PIK3CA H1047R and control tumors and matched tSNEs depicting the distribution of gene expression. P values calculated using Wilcoxon rank-sum test. (D) Frequency of Ccr2hi or F4/80+ cells previously gated on CD45+ and CD11b+. Representative flow plots (left) and summary (right). (E) Frequency of Ccr2hi cells from individual tumors by flow cytometry as in (D) from animals with control tumors on left flank and PIK3CA H1047R on right flank. (F) Differences in cytokine quantification of inflammatory cytokines from tumor supernatants from control or PIK3CA H1047R MC38 tumors collected at day 15. (G) Correlation of PIK3CA and mRNA levels with CCR2 mRNA levels in indicated cancers. Volcano plot showing the Spearman’s correlation and estimated significance from RNA-sequencing data across The Cancer Genome Atlas (TCGA) cancer types calculated by Tumor Immune Estimation Resource and adjusted for tumor purity.27 Each dot represents a cancer type in TCGA; red dots indicate significant correlations (p<0.05). (H) Correlation of indicated immune cell type fraction estimated by CIBERSORT with hallmark PI3K/AKT/MTOR signaling signature from MsigDB scored by single sample gene set enrichment.28 29 31 ns, not significant. *P<0.05; ***p<0.001.

