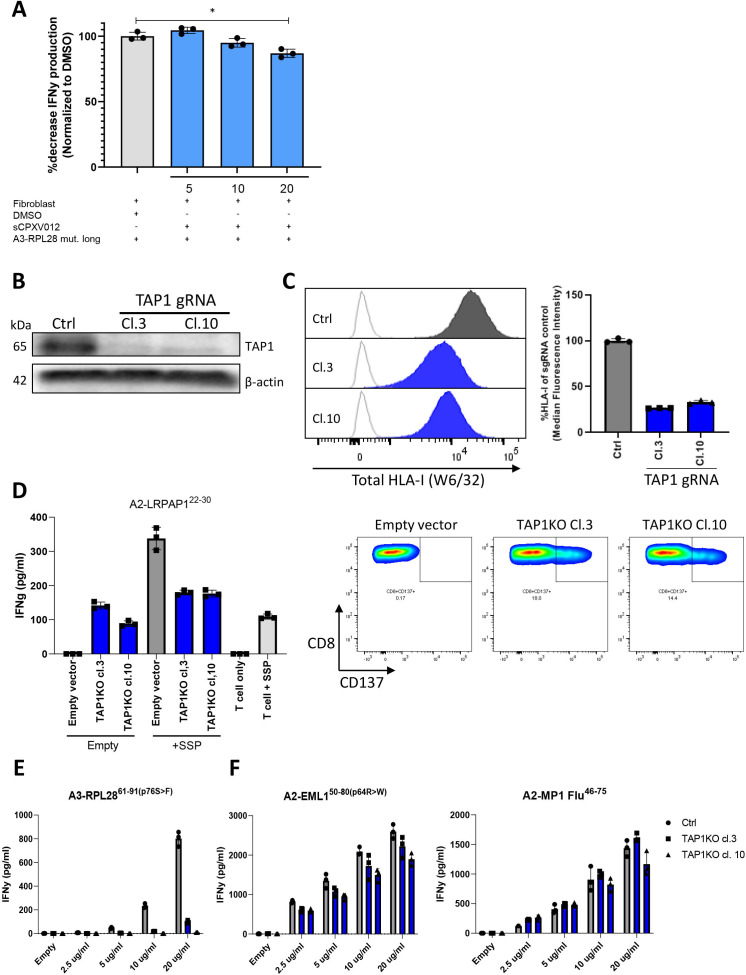
Figure 3.
Role of TAP1 in SLP cross-presentation by fibroblasts. (A) NBS fibroblasts were preincubated with sCPVX012 at indicated concentrations and subsequently loaded with A3-RPL2861-91(p76S>F) (20 µg/mL). After 24 hours coincubation with neoantigen-specific T cells, IFNγ production was determined and plotted as a percentage decrease compared with the uninhibited condition. Means with SD are plotted from representative experiments (n=2). *p≤0.001 as determined by one-way ANOVA with correction for multiple testing. (B) TAP1 expression in TAP1KO fibroblast clones and vector control as determined by Western blot. (C) Total (left panel) and relative (right panel) HLA-I expression on TAP1KO fibroblast clones and vector control determined by flow cytometry. (D) IFNγ production of LRPAP1-specific T cell bulk after coincubation with empty or LRPAP-1 synthetic short peptide (SSP)-loaded TAP1KO fibroblast clones after 24 hours (left panel). Right panel shows the expression of CD137 on LRPAP1-specific T cells after coincubation with empty TAP1KO fibroblast clones or vector control. Representative figures are plotted from independent replicates (n=2). (E) IFNγ production by neoantigen-specific T cells after 24 hours coincubation with antigen presenting HLA-A3+ NBS fibroblast (gray, vector control; blue, TAP1KO clones) loaded with varying concentrations of the A3-RPL2861-91(p76S>F) SLP. Means with SD are plotted from representative experiments (n=3). (F) IFNγ production by antigen-specific T cells after 24 hours co-incubation with antigen presenting HLA-A2 +NBS fibroblast (gray, vector control; blue, TAP1KO clones) loaded with varying concentrations of either the A2-EML150-80(p64R>W) or A2-MP1 Flu46-75 SLP. Means with SD are plotted from representative experiments (n=2). ANOVA, analysis of variance; DMSO, dimethylsulfoxide; NBS, Nijmegen Breakage Syndrome; SLP, synthetic long peptide.

