Figure 5.
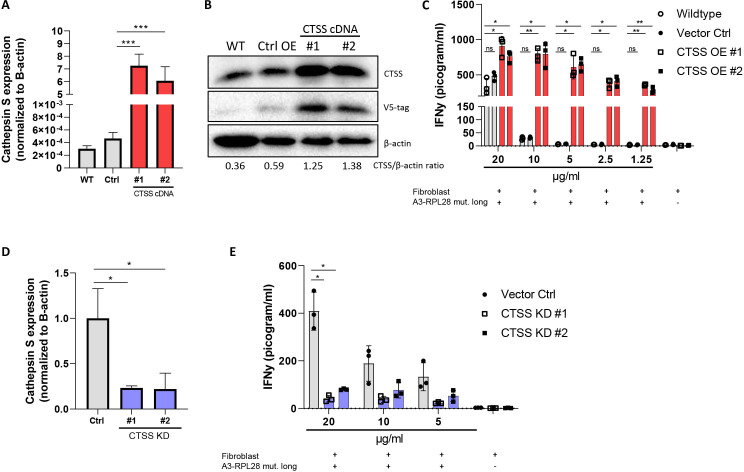
Cathepsin S enhances cross-presentation in fibroblasts. (A) Relative expression of cathepsin S (CTSS) in NBS wildtype (gray bar), vector control (gray bar) and two CTSS overexpressing NBS fibroblasts (#1 and #2, red bars) normalized for expression of β-actin. Student’s t-test ***p≤0.0001 (B) Western blot analysis of cathepsin S expression in NBS wildtype, vector control and CTSS overexpressing fibroblasts. The CTSS/β-actin ration is shown for quantification. (C) IFNγ production by neoantigen-specific T cells after 24 hours coincubation with wildtype (gray bar), vector control (gray bar) and CTSS overexpressing NBS fibroblasts (red bars). Means with SD are plotted from representative experiments (n=4). Two-tailed ANOVA with correction for multiple testing *p≤0.05, **p≤0.01. (D) Expression of cathepsin S in CRC-conditioned fibroblasts with shRNA-mediated cathepsin S knockdown. Student’s t test *p≤0.05. (E) IFNγ production by neoantigen-specific T cells after 24 hours coincubation with cathepsin-S KD (blue bars) and vector control CRC-conditioned NBS fibroblasts (gray bar). Means with SD are plotted from representative experiments (n=2). Two-tailed ANOVA with correction for multiple testing *p≤0.05. ANOVA, analysis of variance; CRC, colorectal cancer; NBS, Nijmegen breakage syndrome.

