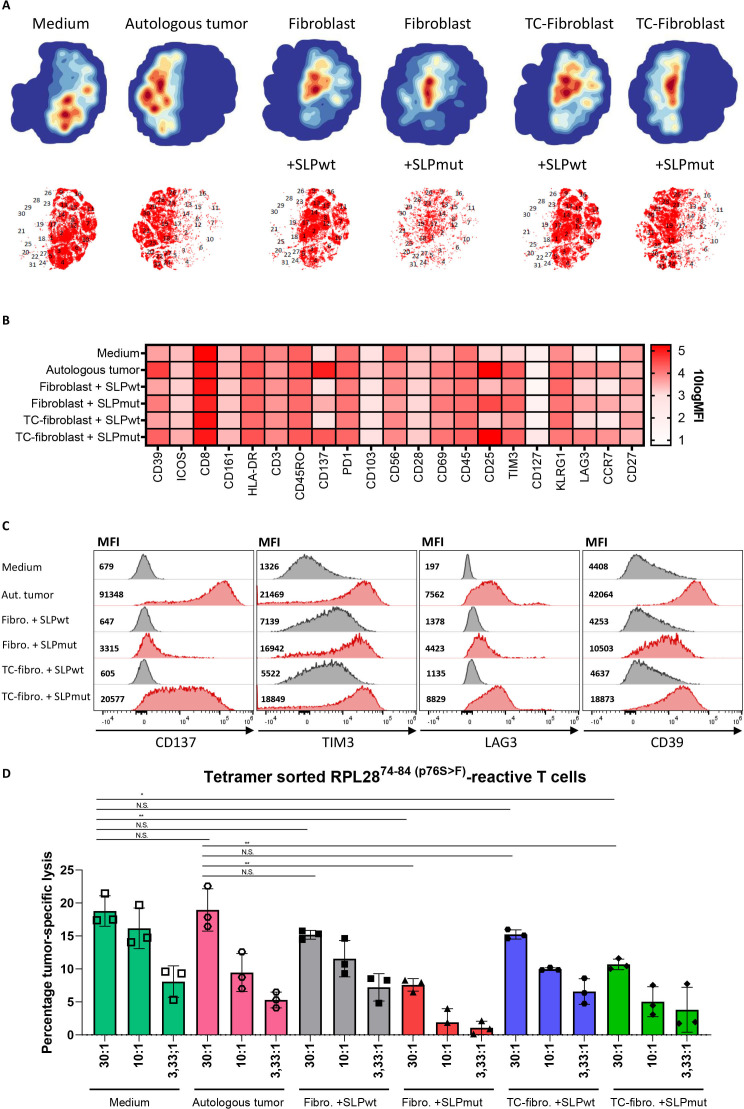
Figure 7.
Fibroblast-mediated antigen cross-presentation results in decreased T cell cytotoxicity. (A) tSNE plots of the expression of activating and inhibitory surface receptors on A3-RPL2874-84(p76S>F) sorted T-cells incubated for 24 hours with medium, autologous tumor cells and (CRC-conditioned) fibroblasts loaded with either A3-RPL2861-91(wildtype) or A3-RPL2861-91(p76S>F). (B) Heatmap showing the 10logMFI of the separate T cell surface markers in the different experimental conditions. (C) Histograms and MFI of CD137, TIM3, LAG3 and CD39 in the different experimental conditions. (D) Percentage specific lysis of autologous tumor cells, determined by26Cr-release assay, by A3-RPL2874-84(p76S>F) sorted T cells after preincubation with the indicated target cell conditions. Means with SD for the 30:1 ratio are plotted from representative experiments (n=2). *P<0.05, **p<0.01 as determined by one-way ANOVA with correction for multiple testing (Dunnett’s test). ANOVA, analysis of variance; tSNE, t-distributed stochastic neighbor embedding CRC, colorectal cancer; MFI, mean fluorescent intensity; ns, not sognificant; TC, tumor conditioned.

