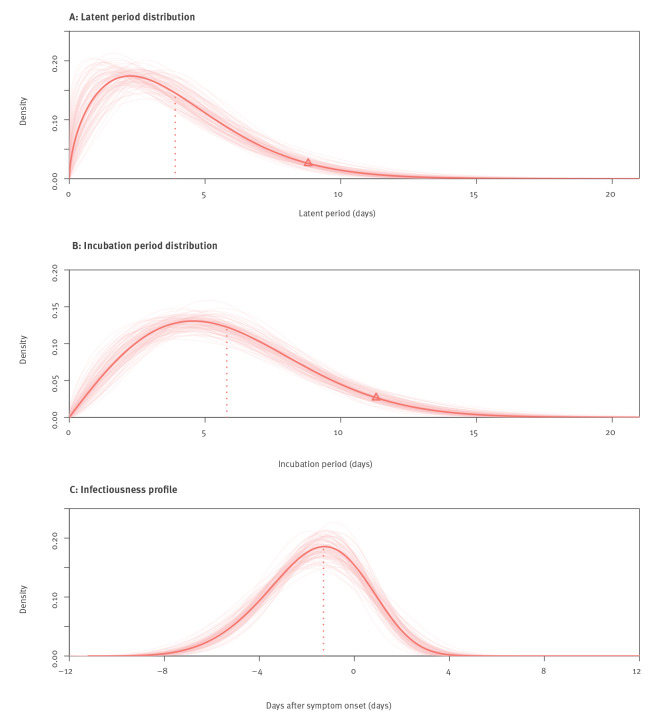
Figure 1.
Key epidemiological time-delay distributions of SARS-CoV-2 Delta variant, Guangdong, China, May–June 2021 (n = 93 transmission pairs)
SARS-CoV-2: severe acute respiratory syndrome coronavirus 2.
Red lines: distributions using mean parameters (shape and scale). We sampled 100 parameters for each distribution to indicate uncertainty (pink lines). Vertical dotted lines: mean estimates for latent period distribution and incubation period distribution, and peak estimate for infectiousness. Triangles in panels A and B: 95th percentiles for respective parameters.

