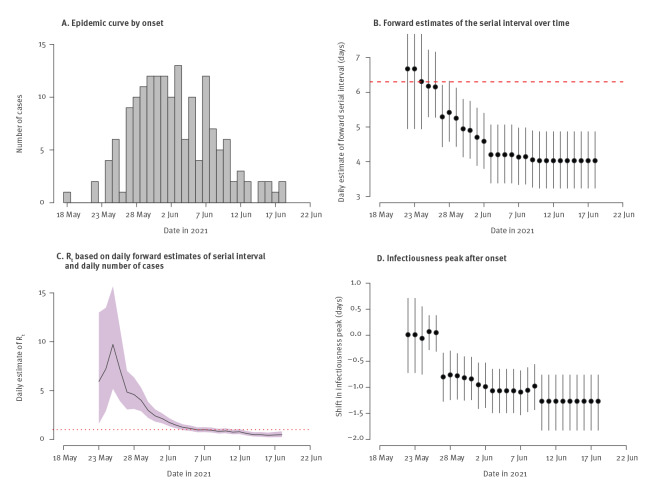
Figure 2.
The estimated daily forward serial intervals and instantaneous reproduction numbers and infectiousness peak during the SARS-CoV-2 Delta outbreak in Guangdong, China, May–June 2021 (n = 93 transmission pairs)
CrI: credible interval; Rt: instantaneous reproduction number; SARS-CoV-2: severe acute respiratory syndrome coronavirus 2.
Panel A is based on symptom onset dates of all cases in the Delta outbreak in Guangdong province. Panel B: dots represent the daily mean estimates of serial interval and the vertical line segments represent the 95% CrI; the dashed line represents the initial (from transmission pairs with illness onsets of infectors before 26 May 2021) forward serial interval (6.3 days). Panel C: the line represents mean estimates of Rt with 95% CrI (shaded area) and the dotted line indicates Rt = 1. Panel D: dots represent the daily mean estimates of time of infectiousness peak in comparison with the onset day with the 95% CrI (vertical line segments).

