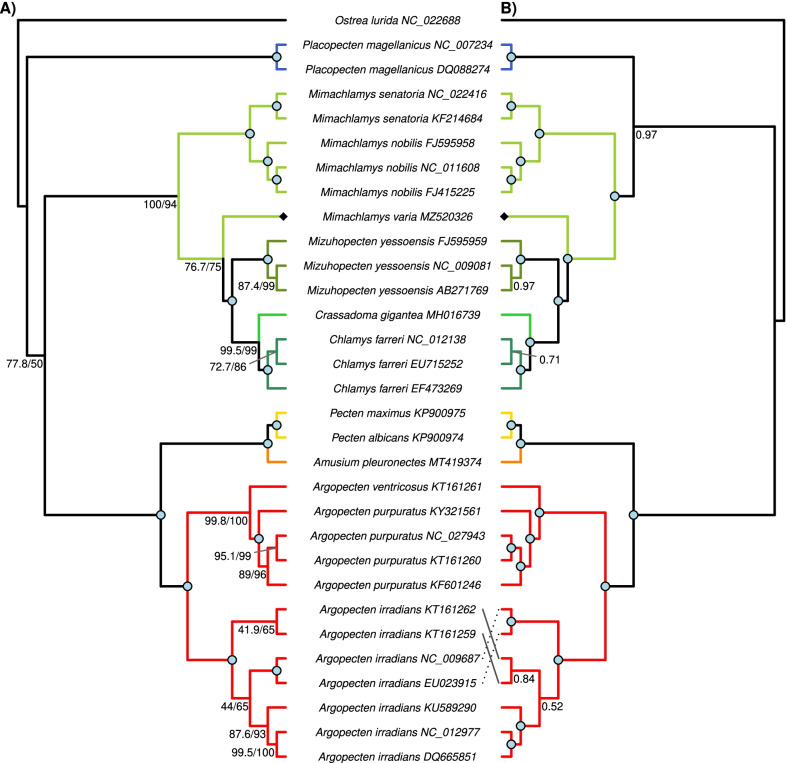
Fig. 4.
Phylogenetic reconstruction of 30 Pectinidae mitogenomes with Ostrea lurida (Ostreidae) as the outgroup, based on the “B” dataset (PCG amino acid and ribosomal DNA sequences). Every genus is marked with a different color, identical to the color coding on Figs. 3 and 5. Mimachlamys varia is marked with a black diamond shape. Fully supported branches are marked with a blue circle on the corresponding node. A Maximum likelihood tree. SH-like approximate likelihood ratio test (SH-aLRT) is presented on the left, ultrafast bootstrap support projected from the extended majority-rule consensus tree is presented on the right. B Bayesian tree. Numbers represent posterior probabilities; the staggered and gray lines connect species names with the corresponding tips. For original branch lengths, see Figs. 3B and 5B

