
Figure 2.
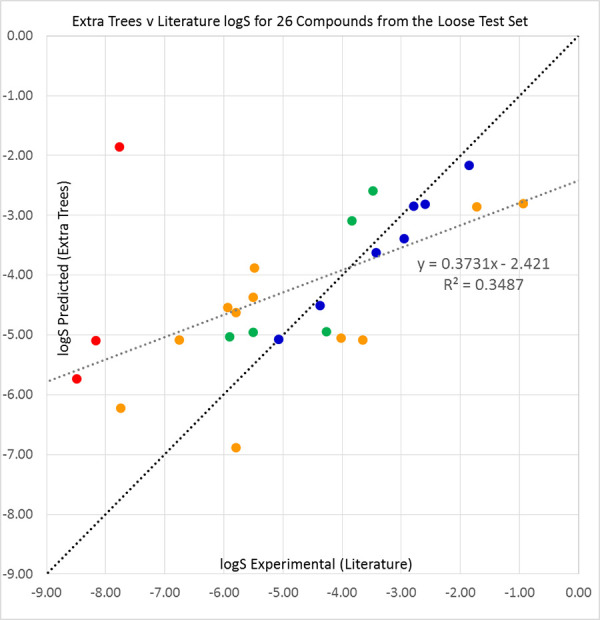
Extra Trees predictions plotted against our sourced literature log S values (see Table A2 for references) for 26 compounds from the 2019 Solubility Challenge loose test set of 32 molecules. Compounds with prediction errors of under 0.5 (blue), 0.5 to 1.0 (green), 1.0 to 2.0 (orange), and over 2.0 log S units (red) are shown in their respective colours. The black diagonal line shows equality of predicted and experimental solubilities, while the grey line is a line of best fit to the data. The large outlier is bisoprolol, as discussed in the text.