Figure 1.
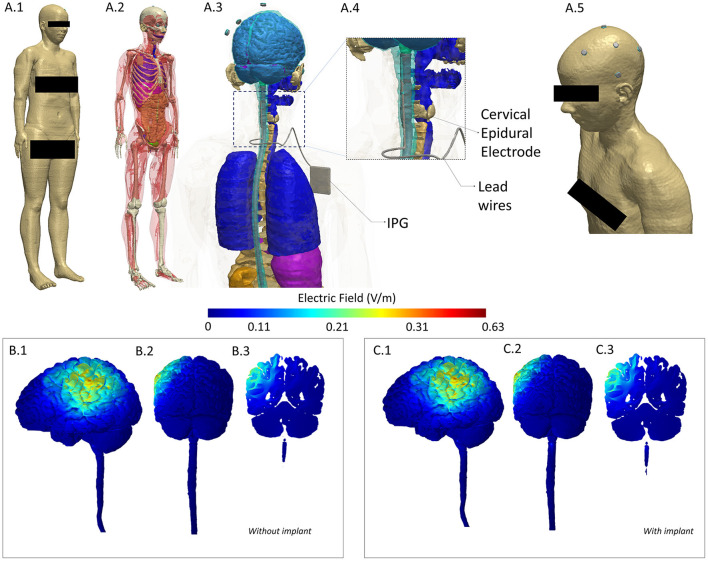
Computational Model of induced electric field to evaluate any alteration due to implant. To investigate deviation (intensity or location of current flow), we considered a model derived from a healthy subject (no implant) and incorporated a spinal cord implant within the same geometry to serve as our implant case. We performed a comparison of induced electric field between the two models and noted a difference of 1.1% in maximum and no difference in mean and median values. (A.1) A full body head model was derived from the Visible Human Project (24). A female dataset was used given the gender of the patient. (A.2) Skin mask is made transparent to reveal tissue segmentation detail. (A.3) Close-up of the model along with geometry of the Spinal Cord Stimulation (SCS) considered. (A.4) The cervical section of the model is expanded to highlight the location of the epidural electrodes and lead wires. (A.5) Skin mask along with stimulation electrodes indicating the montage simulated replicated anodal HD-tDCS over left M1. (B.1–B.3) 3D Left Lateral, 3D Posterior, and 2D coronal plots of induced electric field in the brain and in the spinal cord for the healthy (no implant) situation. (C.1–C3) Corresponding views for the implant situation. Results indicate no alteration in current flow—at left M1 (both at cortical surface and in deeper areas) and in overall pattern. Further, posterior plots indicate no deviation locally at the implant level (see the spinal cord section in B.2,C.2). All methods and analyses were based on prior work by our group (25–27). A current injection of 1.5 mA and the classic Laplace's equation was used to determine induced current flow.

