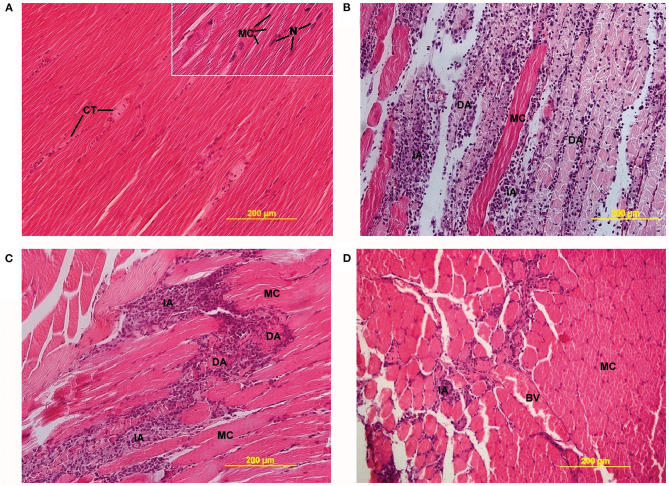
Figure 2.
Light microscopy images of LA-induced myotoxicity. (A) Skeletal muscle 2 days after 0.9% saline injection, showing connective tissue (CT) between normal muscle fibers (MC) (20× magnification, insert 40×). (B) Skeletal muscle 2 days after 0.5% bupivacaine injection, showing degenerative (DA) and inflammatory areas (IA) alternated with MC (20× magnification). (C) Skeletal muscle 2 days after 0.5% ropivacaine injection, also displaying DA and IA (20× magnification). (D) Skeletal muscle 2 days after 0.5% levobupivacaine injection, showing incidental IA and blood vessels (BV) between MC (20× magnification). Öz Gergin et al. Comparison of the Myotoxic Effects of Levobupivacaine, Bupivacaine, and Ropivacaine: An Electron Microscopic Study. Ultrastructural Pathology, May 2015. Reprinted by permission of the publisher (Taylor & Francis Ltd.) (34).

