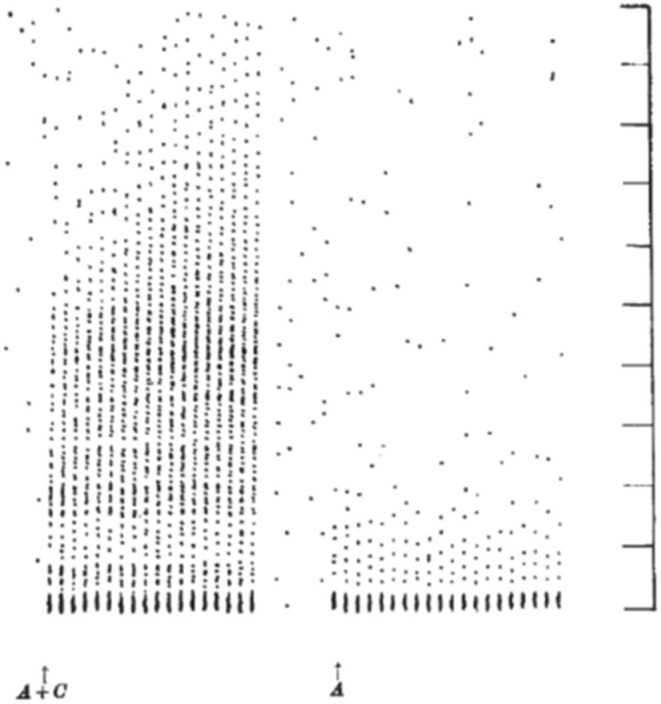
Figure 1.

Dot raster display of response of an axon in the dorsolateral lumbar spinal cord in a spinal cat to repetitive stimulation of the ipsilateral sural nerve at a strength to activate A- and C- fibers (left) and A-fibers (right). Each response is shown as a vertical line of dots with each dot representing a single action potential. The stimuli were delivered every 1.3 s. Vertical markers denote 100 ms intervals. The response to the 20 A-fiber stimuli (right) consists of a high frequency burst lasting about 25 ms followed by a silent period and then resumption of spontaneous activity. When C- fibers were also stimulated (left), later activity was also observed. Notably, the late discharge increased in length with repetition of the stimulation (18 delivered in total) (From Figure 2 of Mendell and Wall, Nature, April 3, 1965, with permission).
