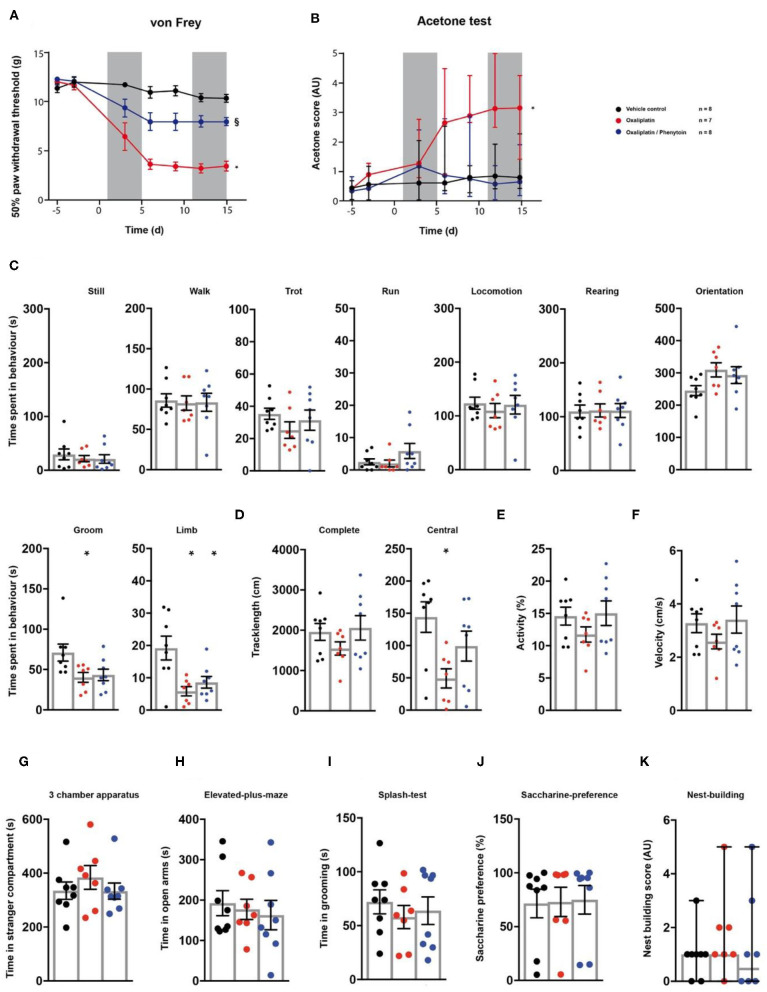
Figure 6.
Effects of phenytoin on oxaliplatin induced symptoms. Oxaliplatin- (red trace), vehicle- (black trace), and oxaliplatin/phenytoin-treated (blue trace) rats were tested on two baseline- and 5 time points post injection for their responses to mechanical- and cold stimuli. Oxaliplatin injections were performed at time points 1–5 and 11–15, as indicated by the two grey fields (A,B). Phenytoin was administered daily from time-point 1–15. At the last testing time point, all groups were subjected to the testing sequence (C–L). (A) von Frey test/mechanical paw withdrawal thresholds. (B) Acetone-test induced responses (median and 95% confidence interval, non-parametric longitudinal analysis). (C–F) Automated classification of voluntary behaviours in the spectroscopy apparatus. The parameters are ordered in general behaviours (C), tracklength (D), overall activity (E), and velocity (F). (G) 3 chamber apparatus/time spent in a compartment with an unknown animal. (H) Elevated plus maze/time spent in open arm exploration. (I) Splash-test/time in induced grooming behaviour. (J) Saccharine preference. (K) Nest building scoring (median ± 95% confidence interval, Kruskal-Wallis test with Dunn's multiple comparison test). Data are expressed as mean ± SEM and analysed using a RM two-way ANOVA (A), followed by Bonferroni's correction. For single time point behavioural tests, a one-way ANOVA with Bonferroni's correction was used (C–K, n = 8 for vehicle control, n = 7 for the oxaliplatin group, n = 8 for the oxaliplatin/phenytoin group). * indicates a significant difference to the vehicle control (p < 0.05); § indicates a significant difference to the oxaliplatin-group (p < 0.05). For detailed p-values of group comparisons, see Table 1.

