
Figure 5.
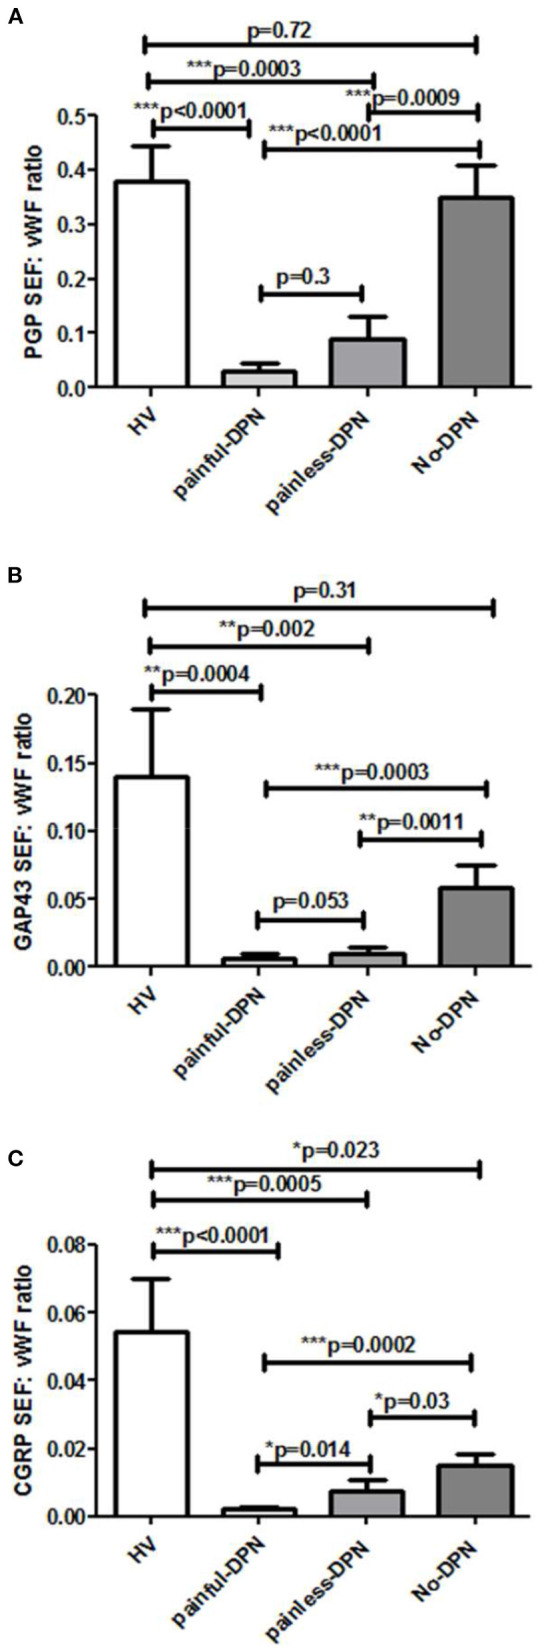
Bar charts showing image analyses (mean ± SEM) of (A) PGP9.5 sub-epidermal nerve fiber (SENF) (SEF): vWF, (B) GAP43 SENF: vWF, and (C) CGRP SENF: vWF ratios.
Official websites use .gov
A
.gov website belongs to an official
government organization in the United States.
Secure .gov websites use HTTPS
A lock (
) or https:// means you've safely
connected to the .gov website. Share sensitive
information only on official, secure websites.
Bar charts showing image analyses (mean ± SEM) of (A) PGP9.5 sub-epidermal nerve fiber (SENF) (SEF): vWF, (B) GAP43 SENF: vWF, and (C) CGRP SENF: vWF ratios.