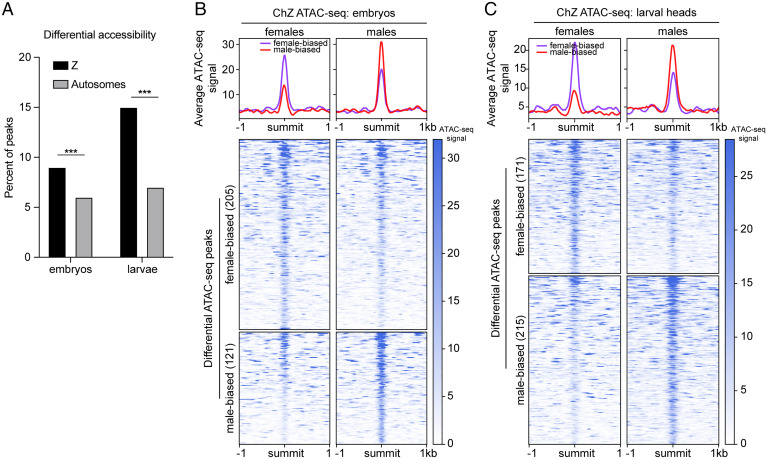
Fig. 5.
ATAC-seq reveals female chZ is more accessible than male chZ in late embryos. (A) Bar graph showing the percent of ATAC-seq peaks with significant differential accessibility (P < 0.05) between males and females on chZ (black) and autosomes (gray) in embryos (Left) and larvae (Right). Significantly more peaks are differentially accessible on chZ at both time points (***P < 0.0001; two-tailed Fishers exact test comparing embryo Z to A, Left, or larval Z to A, Right). (B and C, Upper) Average ATAC-seq signal across differentially accessible ATAC-seq peaks between males and females on chZ in late embryos (B) and larvae (C). Average male signal is shown in red and female signal is in purple. (Lower) Heatmaps of signal at individual differential peaks in embryos (B) and larvae (C) are shown. The number of differential peaks is indicated in parentheses. Female-biased peaks are shown in the top map and male-biased peaks in the bottom map. Signal in females is shown on the left. Signal in males is shown on the right. Peaks are sorted by decreasing signal.

