Fig. 1.
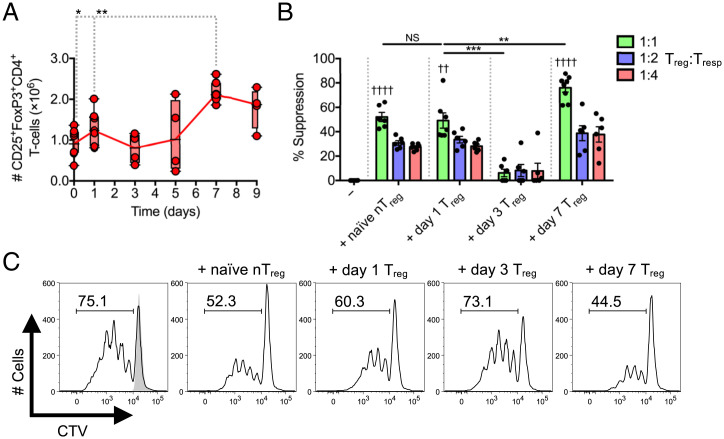
Treg responses during Listeria infection display a biphasic kinetic pattern. C57BL/6 mice infected with L. monocytogenes ΔactA-Ova. (A) Number of CD25+FoxP3+CD4+ Tregs in spleens 0 to 9 d postinfection (n = 4 to 8 per group). (B and C) In vitro CD45.1+CD8+ Tresps proliferation/percent suppression at day 3 after coculture with CD45.2+CD4+FoxP3-eGFP+ Tregs isolated from naïve Foxp3eGFP mice and those that underwent 1, 3, or 7 d of infection. Indicated are titrated Treg:Tresp ratios after anti-CD3/CD28 stimulation (n = 4 per group). Reported in histograms are percentage and data from 1:1 Treg:Tresp cocultures. Mean ± SEM; (A and B) *P < 0.05, **P < 0.01, and ***P < 0.001 (Student’s t test); (B) ††P < 0.01 and ††††P < 0.0001 (one-way ANOVA relative to −Treg). CTV, CellTrace Violet; NS, not significant.

