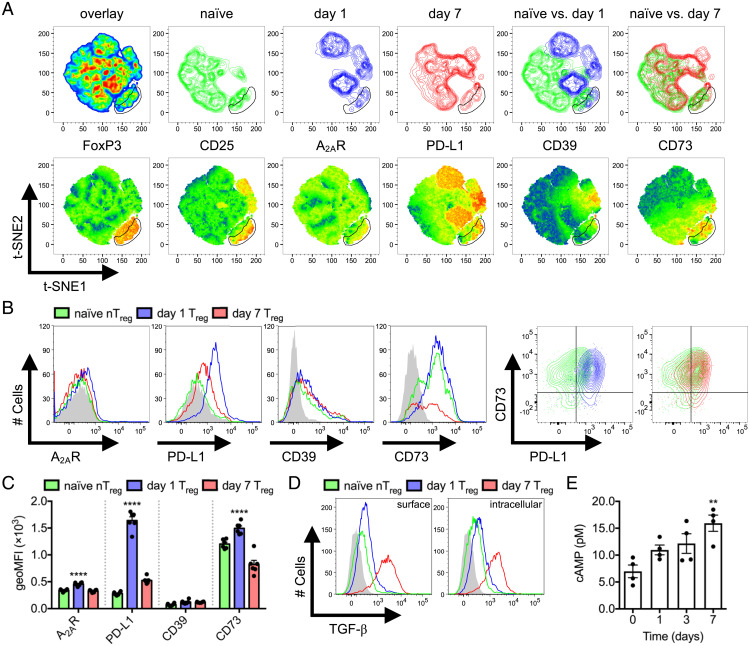
Fig. 4.
Temporal variation of Treg effector mechanisms. Naïve compared to day 1 and 7 L. monocytogenes ΔactA-Ova–infected C57BL/6 mice. (A) t-SNE analysis of CD4+ T cells with FoxP3, CD25, A2AR, PD-L1, CD39, and CD73 dimensions. Density plots (Upper) and heatmap statistic displays of each input parameter (Lower) are displayed (n = 6 per group). (B and C) Expression of A2AR, PD-L1, CD39, and CD73 on Treg surface defined in A (n = 6 per group). (D) Expression of surface displayed and intracellular TGF-β by Tregs after PMA/ionomycin restimulation (n = 4 per group). (E) Intracellular FoxP3-eGFP+ Treg cAMP concentration after sorting from naïve Foxp3eGFP mice and those at days 1, 3, and 7 following L. monocytogenes ΔactA-Ova infection (n = 4 per group). Filled histograms represent fluorescence minus one (FMO). Mean ± SEM. (C and E) **P < 0.01 and ****P < 0.0001 (one-way ANOVA).

