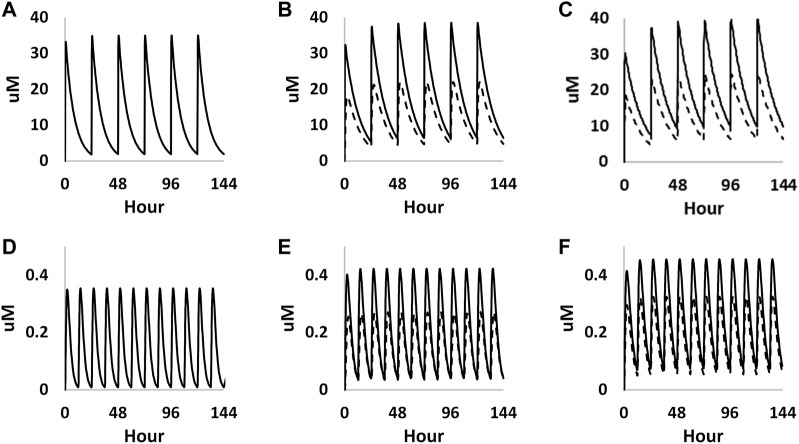
FIGURE 9.
PBK simulations on plasma concentration time profiles of caffeine in both mother (solid curves) and foetus (dashed curves) through different gestational ages. (A–C) represent prediction on week 6, week 20 and week 30 from oral exposure, respectively. (D–F) represent predations on week 6, week 20 and week 30 from dermal exposure, respectively.

