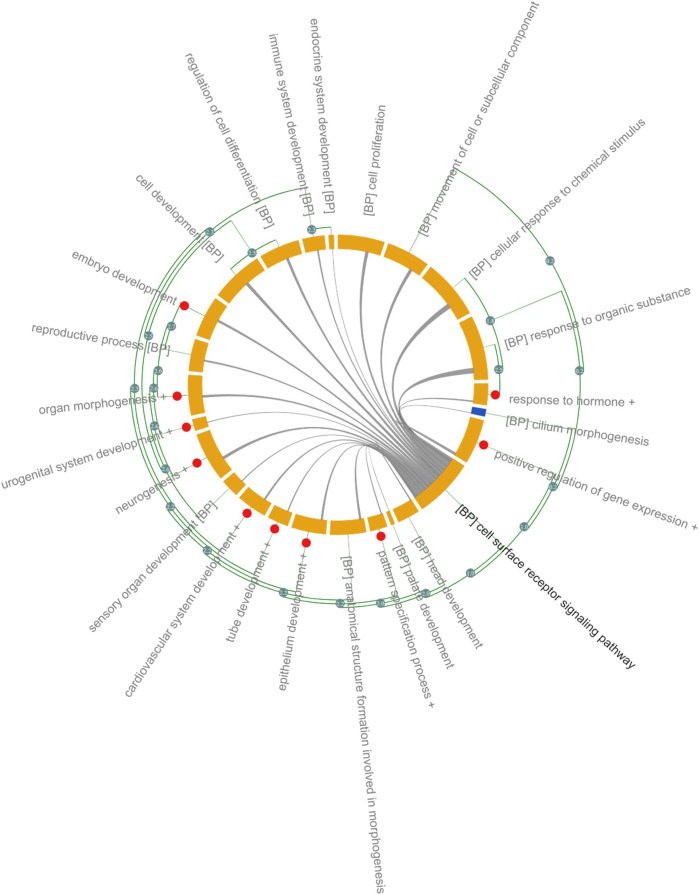
FIGURE 2.
Gene Ontology Analysis of DARTable genome. Chord diagram (Xin et al., 2020) showing overrepresented (FDR corrected p < 0.05) GO-BP in the Human DARTable Genome from (A). GO-BP and were clustered based on Resnick similarity between terms. Each element (orange) on the diagram represents a GO-BP or clustered terms (Resnik similarity score>2.7) which are represented as red circles. The length of the element is proportional to the number of genes related to the GO-BP or cluster of GO-BPs. The green edges parallel to the main chord diagram on the outside show possible clusters between terms. The edges inside the diagram show shared genes between the GO-BPs and the width of the edges is proportional to the size of the overlap. In this example, GO-BP cell surface receptor signalling pathway (bolded) shares genes with sensory organ development, chemical response to stimulus and response to organic substance compared to endocrine system development. Percentage overlap between cell surface receptor signalling and other GO-BP can be found in Supplementary File S2.

