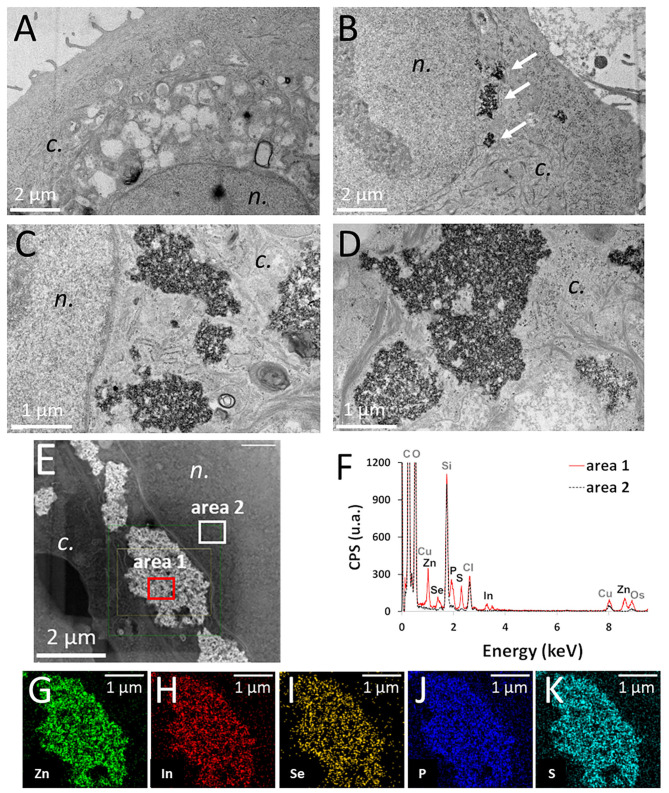
Figure 2.
Intracellular distribution of pristine thick shell quantum dots (QDs) in keratinocytes, observed by transmission electron microscope (TEM) and scanning-transmission electron microscope (STEM) imaging, coupled to energy-dispersive X-ray spectroscopy (EDX) analysis. Control cells (unexposed) (A), cells exposed for 24 h to 50 nM of pristine thick shell QD [(B–D), white arrows in panel (B): agglomerates of QDs]. High-angle annular dark-field imaging (HAADF) mapping of a cell exposed to 50 nM of pristine thick-shell QD (E) and EDX analysis of the areas 1 (red) and 2 (black dashed) of this image (F), with image representation of the distribution of Zn (G), In (H), Se (I), P (J), and S (K). n, nucleus; c, cytoplasm.

