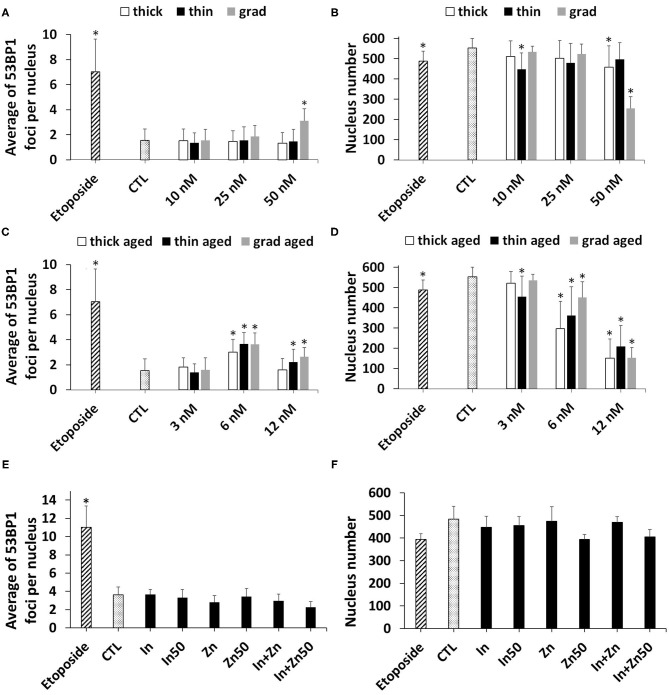
Figure 7.
Quantum dot (QD) genotoxicity, assessed via 53BP1 immunostaining. Counting of 53BP1 foci (A,C,E) and of cell nuclei (B,D,F) via automated counting by HCA. Cells were exposed for 24 h to pristine QDs (A,B) or aged QDs (C,D). Cells exposed to 3.75 nM (In) or 50 nM (In50) of In(III)-acetate, 15 nM (Zn) or 50 M (Zn50) of Zn(II)-acetate, a mixture of 3.75 μM of In(III)-acetate and 15 μM of Zn(II)-acetate (In + Zn), or a mixture of 50 μM of In(III)-acetate and 50 μM of Zn(II)-acetate (In + Zn50) (E,F). Etoposide (100 μM) was used as a positive control. Data are mean ± standard deviation of three independent experiments, performed on human primary keratinocytes from two different donors, with five replicates per experiment. Statistical significance: p < 0.05, *exposed vs. control.

