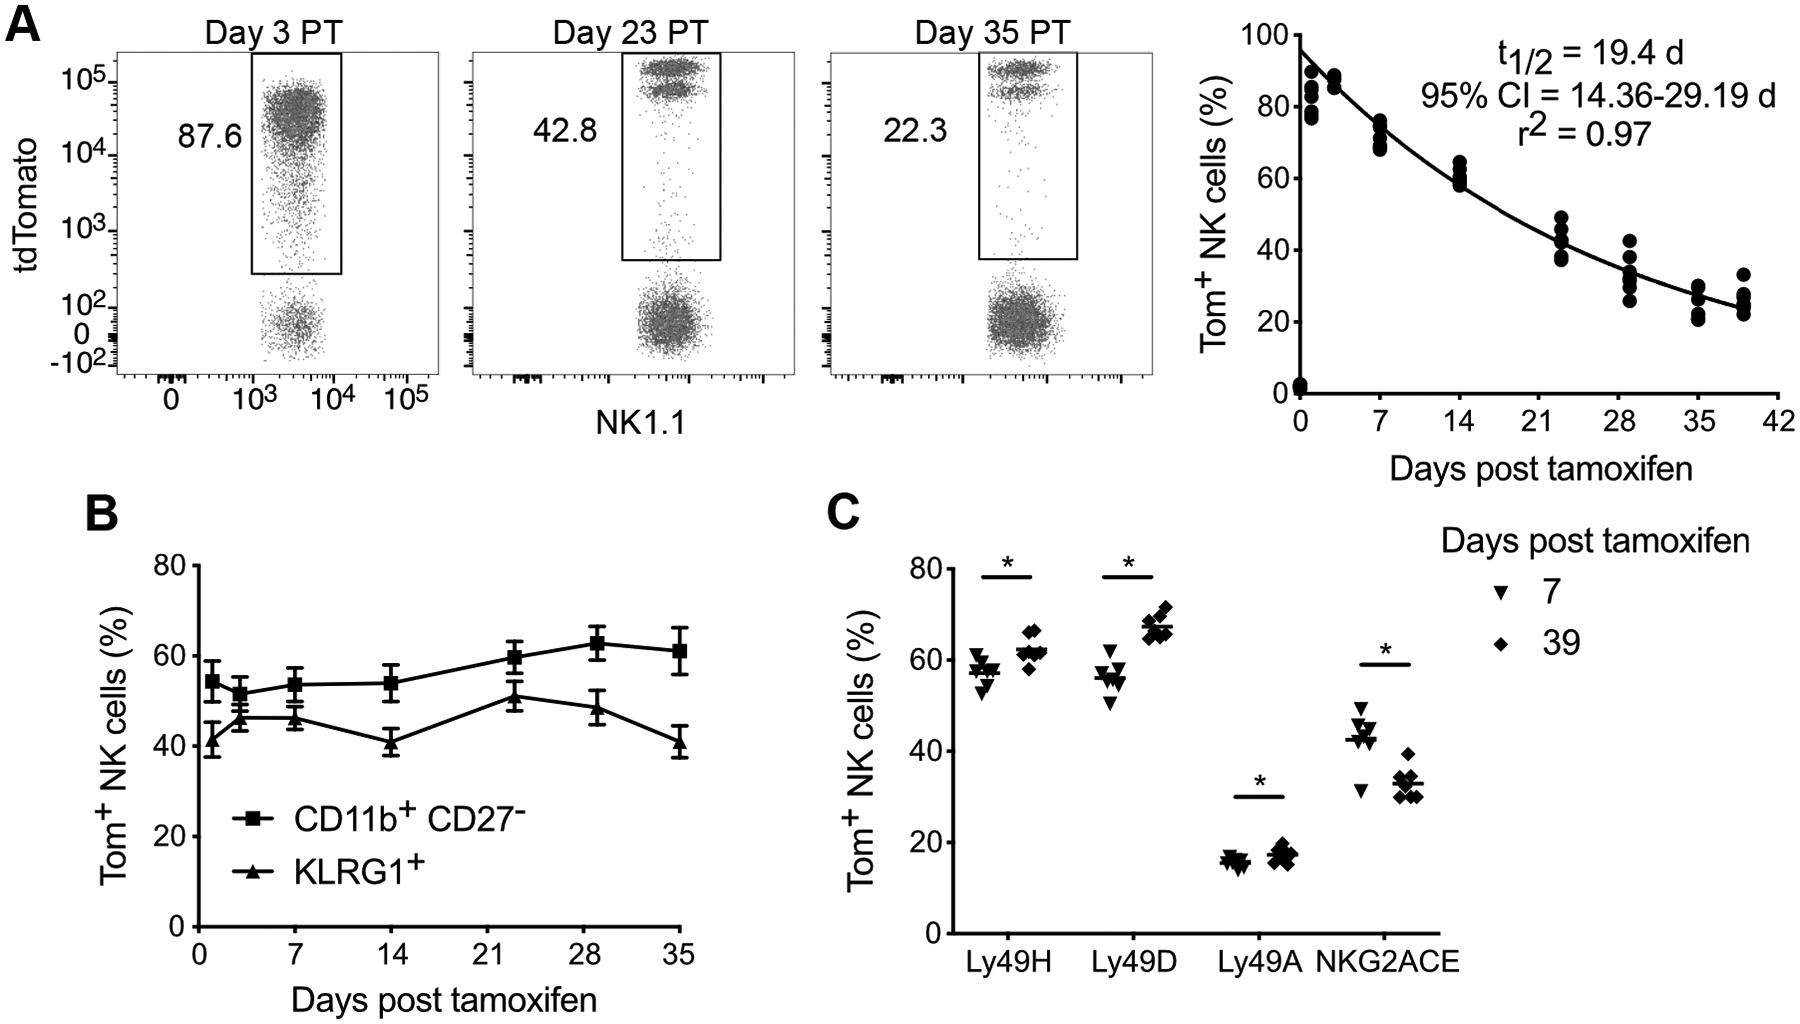
Figure 1. iNkp46tdTomato mice are a tool to characterize NK cell homeostatic turnover.

(A) Flow plots illustrating percentage of NK cells (TCRβ− CD3ε− NK1.1+) expressing tdTomato (Tom+) in blood at indicated days post tamoxifen (PT) (left). Data were fitted with one phase decay curve between day 3–39 PT (right). t1/2 parameter represents half-life of the best-fit curve, and r2 indicates the goodness-of-fit of the model to the experimental data.
(B) Percentage of blood Tom+ NK cells within the most mature CD11b+ CD27− subset or expressing KLRG1 at indicated days PT.
(C) Percentage of blood Tom+ NK cells expressing the indicated activating and inhibitory receptors at day 7 PT or day 39 PT. Horizontal bar indicates mean. Groups were compared via a paired, two-tailed t test.
Data are representative of at least 3 independent experiments with 3–7 mice per experiment. Data are presented as the mean ± S.E.M. *p <0.05.
