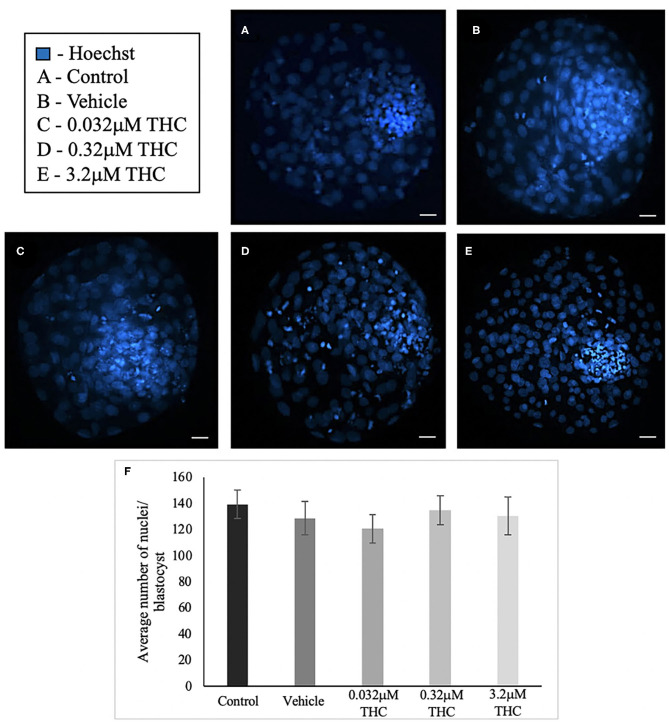
Figure 4.
Total nuclei count in blastocysts produced from THC treated oocytes. (A) Control blastocyst. (B) Vehicle blastocyst. (C) Low (THC) (0.032 μM) blastocyst. (D) Mid (THC) (0.32 μM) blastocyst. (E) High (THC) (3.2 μM) blastocyst. (F) Total cell number. Oocytes were matured in doses of THC correlating to therapeutic cannabis use [low (THC)] and recreational cannabis use [mid (THC), high (THC)] as well as vehicle and control groups, followed by fertilization and culture to the blastocyst stage. Blastocysts were collected at 8 days post-fertilization and stained using either the differential staining or TUNEL protocol. Blastocysts were imaged with a Leica CTR5500B fluorescent microscope at the 20 × objective. Cells were counted manually and verified using ImageJ software. Each group had 25–34 biological replicates (blastocysts) analyzed. Bars represent the mean ± SEM. Scale bar =100 μm.

