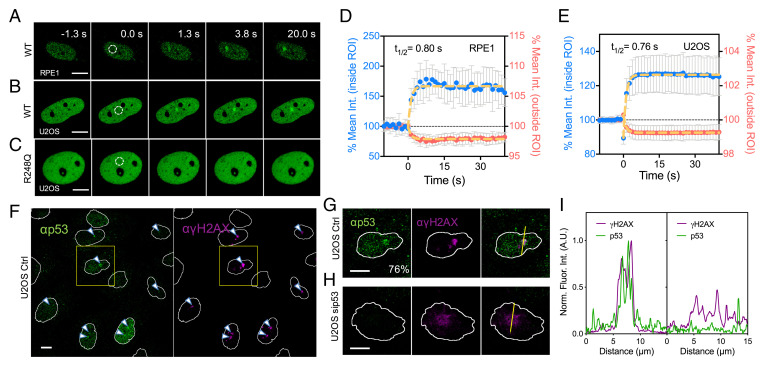
Fig. 1.
Rapid accumulation of WT p53, but not the R248Q mutant, at sites of DNA damage upon laser microirradiation. (A) Representative montage showing the rapid recruitment of endogenous WT p53 with a CRISPR-KI mNG tag in RPE1 cells. (B) Similar montage showing that overexpressed WT p53-EGFP also accumulated at DNA damage sites in U2OS cells. (C) The rapid accumulation is however not detected with the p53 DNA-binding mutant, R248Q. White dotted circle indicates irradiated area. (D and E) Quantification of fluorescence intensity within ROIs, whose diameter is set at 2.5 μm: (D) endogenous WT p53-mNG in RPE1 cells (mean ± SD, n = 19) and (E) WT p53-EGFP in U2OS cells (mean ± SD, n = 30). Signal intensity measurements outside the ROI indicate that p53 protein is being redistributed rapidly following irradiation. Yellow dotted lines indicate single exponential fitting. (F) Global and (G) zoomed-in views of immunostaining of endogenous WT p53 and γH2AX in U2OS cells 5 min after irradiation. (H) The staining of p53 at DNA damage sites is not detectable in U2OS treated with siRNA against p53 and the staining of γH2AX appears more diffuse. Yellow lines indicate the region used for intensity profile analysis. (I) Corresponding line intensity profile of the yellow lines demonstrating the colocalization of p53 and γH2AX at early time points after laser irradiation (Left, G) or the lack thereof (Right, H). (Scale bars, 10 μm.)

