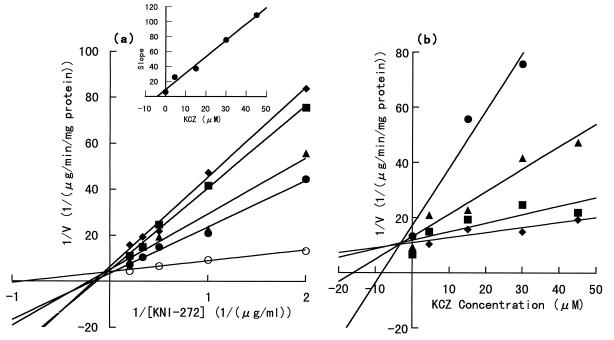
FIG. 6.
Inhibition kinetics of KNI-272 metabolism by KCZ in rat liver microsomes. Each point represents the mean from three experiments (two to three rats per experiment). (a) Lineweaver-Burk plot. KCZ concentrations in the rat liver microsomal reaction mixture are 4.5 (●), 15.0 (▴), 30.0 (■), and 45.0 (⧫) μM. ○, control (no KCZ). (Inset) Plot of the slopes from the Lineweaver-Burk plot against the KCZ concentration. The Ki was estimated from the x-axis intercept. (b) Dixon plot. KNI-272 concentrations in the rat liver microsomal reaction mixture are 0.5 (●), 1.0 (▴), 2.0 (■), and 3.0 (⧫) μM.

