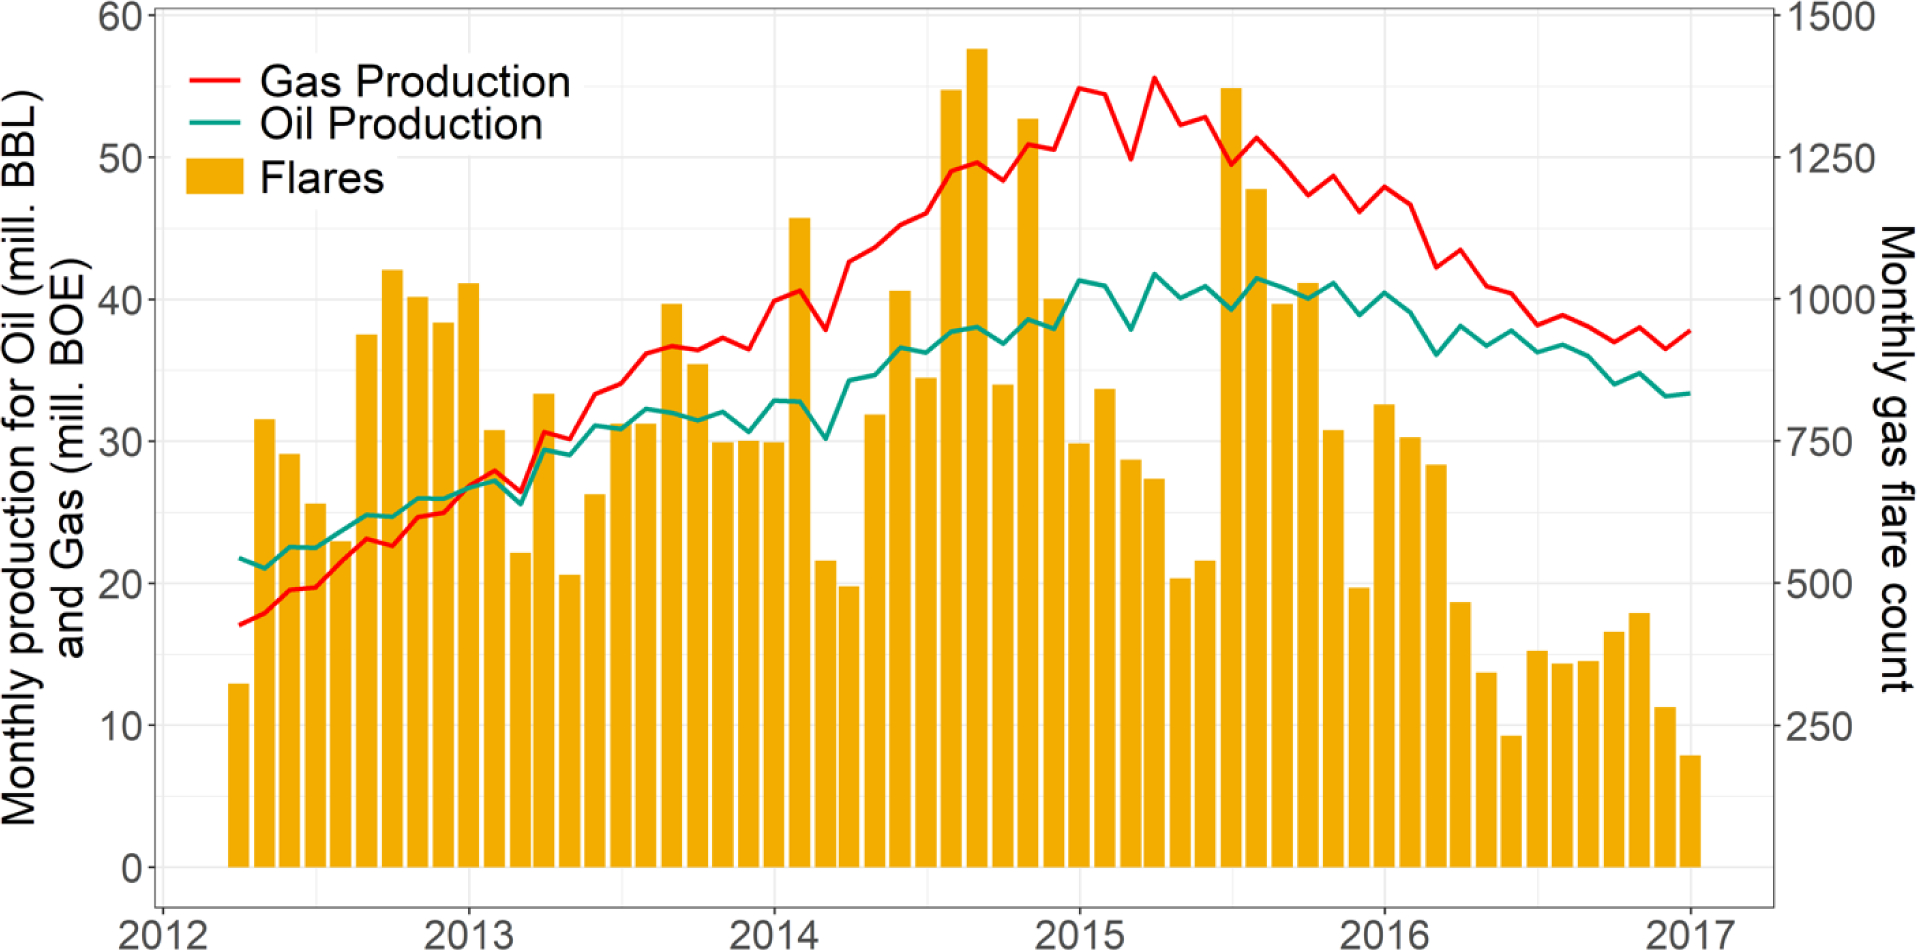
Figure 3.

Oil and gas production (lines) and monthly flare counts (bars) for the Eagle Ford shale play region from 2012–2016. Values represent total reported oil (green, in million barrels, mill. BBL) and gas (red, in million barrels of oil equivalent, mill. BOE) production, respectively, for each month during the study period. Flare counts (yellow) are the sum of nightly VIIRS-detected gas flare events for each month.
