
Figure 5.
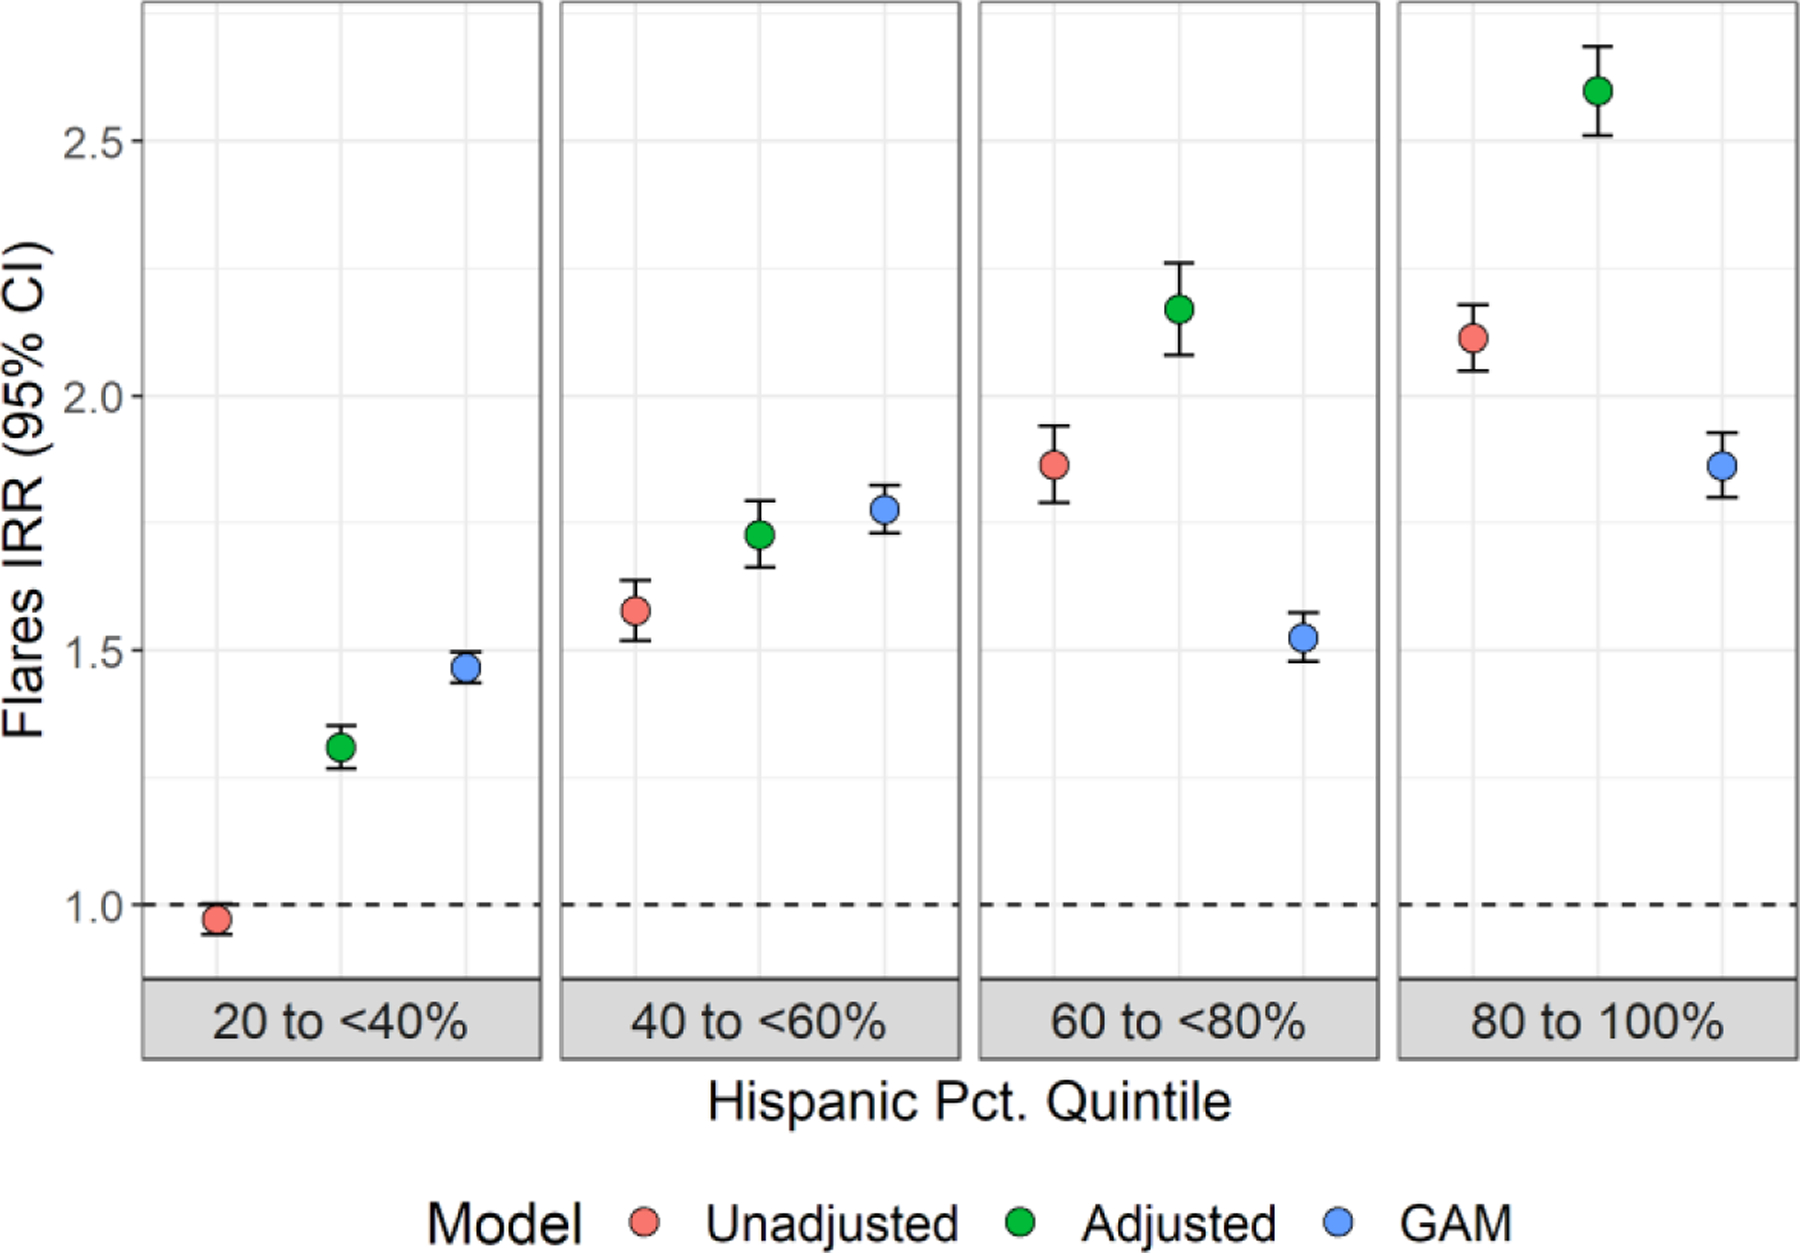
Incidence Rate Ratios (IRRs) comparing the number of flares within 5 km of census blocks with more than 20% Hispanic residents compared to those <20% Hispanic, unadjusted, adjusted for rurality and accounting for rurality and spatial autocorrelation (GAM) in the Eagle Ford shale play, Texas, 2012–2016.