Figure 4.

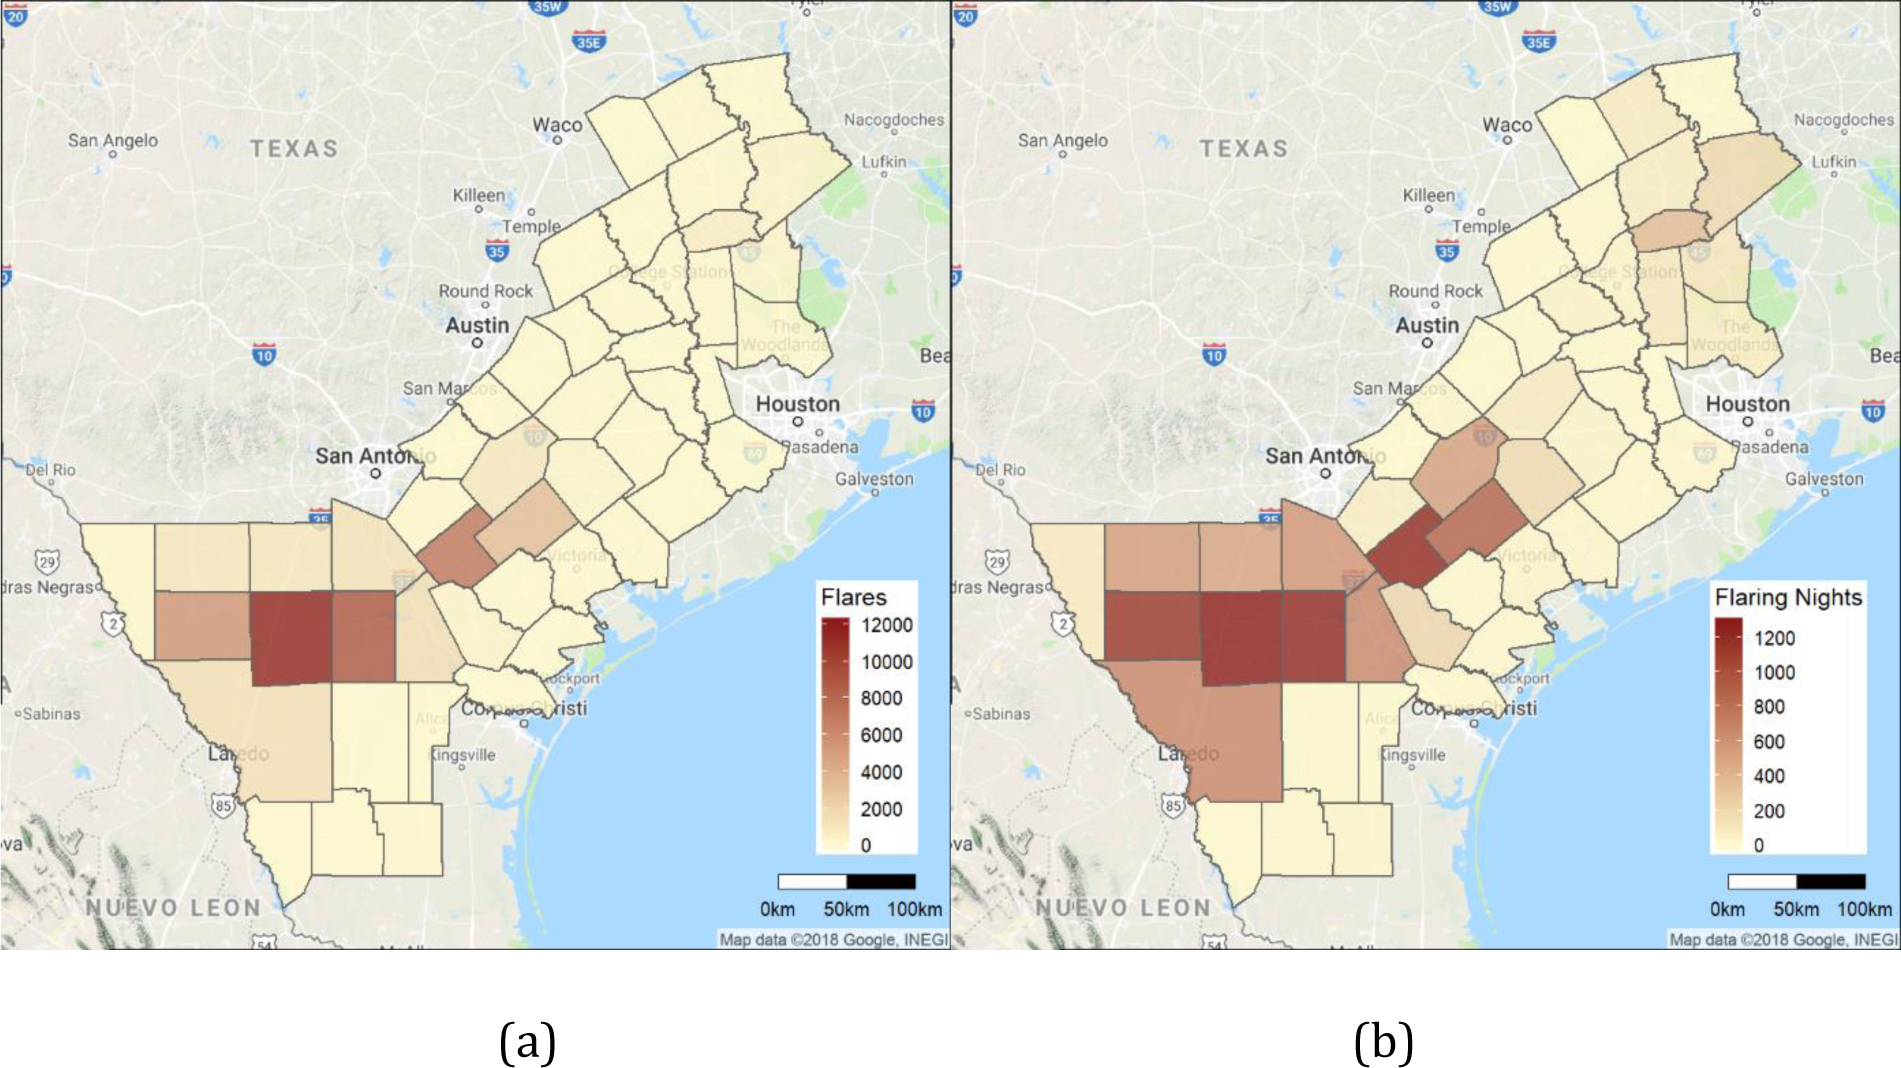
County representations of the total number of flares (a) and the number of nights with at least one flare in the county (b) over the 2012 to 2016 study period.

County representations of the total number of flares (a) and the number of nights with at least one flare in the county (b) over the 2012 to 2016 study period.